EKG interpretation basics

Editor-In-Chief: C. Michael Gibson, M.S., M.D. [1]
Associate Editor-In-Chief: Cafer Zorkun, M.D., Ph.D. [2]
See also Electrocardiogram
How do I begin to read an ECG?
-
![A short ECG recording of normal heart rhythm (sinus rhythm)]]](/images/1/18/Nsr.png) A short ECG recording of normal heart rhythm (sinus rhythm)]]
A short ECG recording of normal heart rhythm (sinus rhythm)]] -
![An example of a normal ECG. Click on the Image for an enlargement]]](/images/7/76/Normaal_ecg.jpg) An example of a normal ECG. Click on the Image for an enlargement]]
An example of a normal ECG. Click on the Image for an enlargement]]
![An example of a normal ECG. Click on the Image for an enlargement]]](/index.php/File:Normaal_ecg.jpg)
Where do you start when interpreting an ECG?
- on the top left are the patient's information, name, sex and date of birth
- at the right of that are below each other the Frequency, the conduction times (PQ,QRS,QT/QTc), and the heart axis (P-top axis, QRS axis and T-top axis)
- further to the right is the interpretation of the ECG written (this often misses in a 'fresh' ECG, but later the interpretation of the cardiologist or computer will be added)
- down left is the 'paper speed' (25 mm/s on the horizontal axis), the sensitivity (10mm/mV) and the filter's frequency (40Hz, filters noise from eg. lights)
- finally there is a calibration on the ECG, on the beginning of every lead is a vertical block that shows with what amplitude a 1 mV signal is drawn. So the height and depth of these signals are a measurement for the voltage. If this is not the set at 10 mm, there is something wrong with the machine setting.
- further we have the ECG leads themselves of course, these will be discussed below.
Note that the lay-out is different for every machine, but most machines will show the information above somewhere.
What does the ECG register?
The ECG is a registration of the heart's electric activity.
Just like skeletal muscles, the heart is electrically stimulated to contract. This stimulation is also called activation or excitation. Cardiac muscles are electrically charged at rest. The inside of the cell is negatively charged relative to the outside (resting potential). If the cardiac muscle cells are electrically stimulated they depolarize (the resting potential changes from negative to positive) and contract.
As the impulse spreads through the heart, the electric field changes continually in size and direction. The ECG is a graphical visualization of these electric signals in the heart.
The ECG represents the sum of the action potentials of millions of cardiomyocytes
-
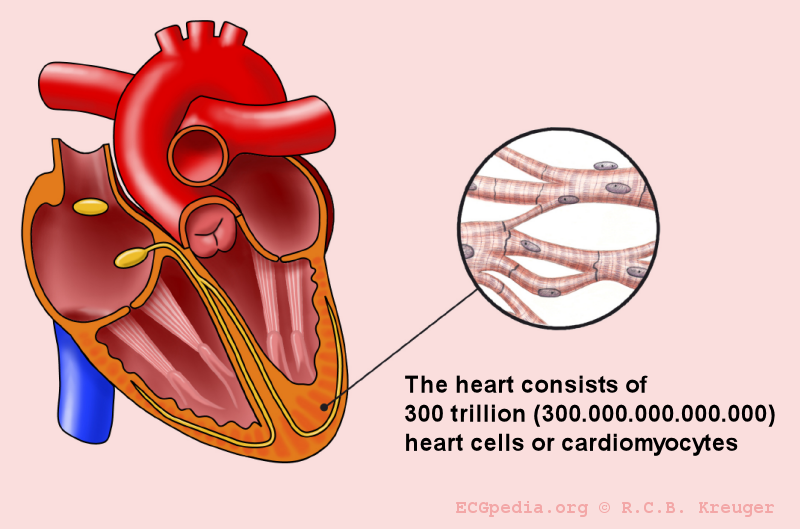 The heart consists of approximately 300 trillion cells
 -
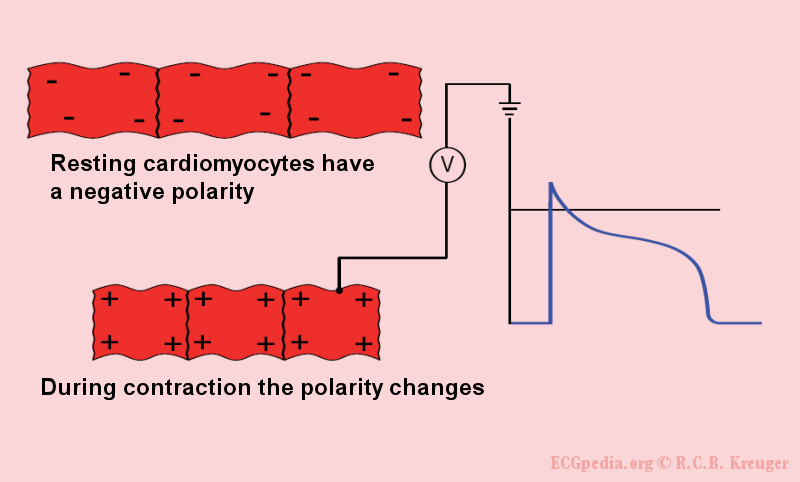 During the rest the heart cells are negatively charged. Through the depolarization by surrounding cells they become positively charged and they contract.
 -
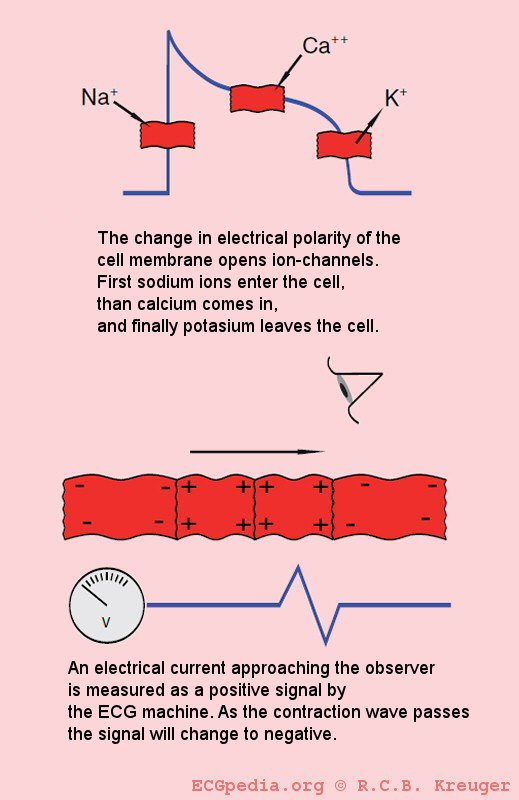 During the depolarization sodium-ions stream inwards the cell. Subsequently the calcium-ions stream into the cell. These calcium-ions give the actual muscular contraction. Finally the potassium-ions stream out of the cell. During the repolarisation the ion concentration is corrected. On the ECG, an action potential wave coming towards the electrode is shown as a positive (upwards) signal. Here the ECG electrode is represented as an eye.


The individual action potentials of the individual cardiomyocytes are averaged. The final result which is shown on the ECG is actually the average of trillions of microscopic electronic signals.
The electric discharge of the heart
The sinoatrial node (SA node) contains pacemaker cells which determine the heart frequency. First the atria depolarize and contract, after that the ventricles The electrical signal between the atria and the ventricles goes from the sinus node, via the atria to the AV-node (atrioventricular transition) to the His bundle and subsequently to the right and left bundle branch, which end in a dense network of Purkinje fibers.

The different ECG waves
The P wave is the result of the atrial depolarization. This depolarization starts in the SA (sino-atrial) node. The signal produces by pacemakercells in the SA node is conducted by the conduction system to the right and left atria. Normal atrial repolarisation is not visible on the ECG (but can be visible during atrial infarction and pericarditis).
The QRS complex is the average of the depolarization waves of the inner (endocardial) and outer (epicardial) cardiomyocytes. As the endocardial cardiomyocytes depolarize slightly earlier than the outer layers, a typical QRS pattern occurs (figure).
The T wave represents the repolarisation of the ventricles. There is no cardiac muscle activity during the T wave.
One heart beat consists of an atrial depolarization --> atrial contraction --> p-wave, ventricular depolarization --> ventricular contraction --> ORS-complex and the resting phase (including the repolarization during the T-wave) between two heart beats.
Have a look at this excellent [animation of the heart cycle]
The origin of the U wave is unknown. This wave possibly results from "after depolarizations" of the ventricles.
The letters "Q", "R" and "S" are used to describe the QRS complex:
- Q: the first negative deflection after the p-wave. If the first deflection is not negative, the Q is absent.
- R: the positive deflection
- S: the negative deflection after the R-wave
- small print letters (q, r, s) are used to describe deflections of small amplitude. For example: qRS = small q, tall R, deep S.
- R`: is used to describe a second R-wave (as in a right bundle branch block)
-
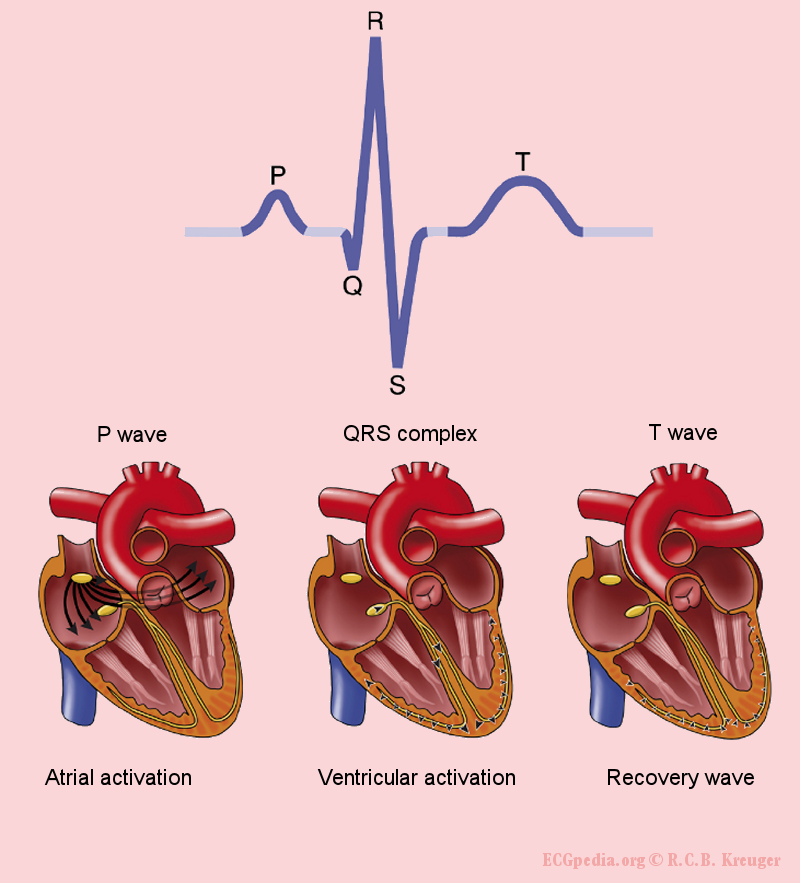 The origin of the different waves on the ECG
 -
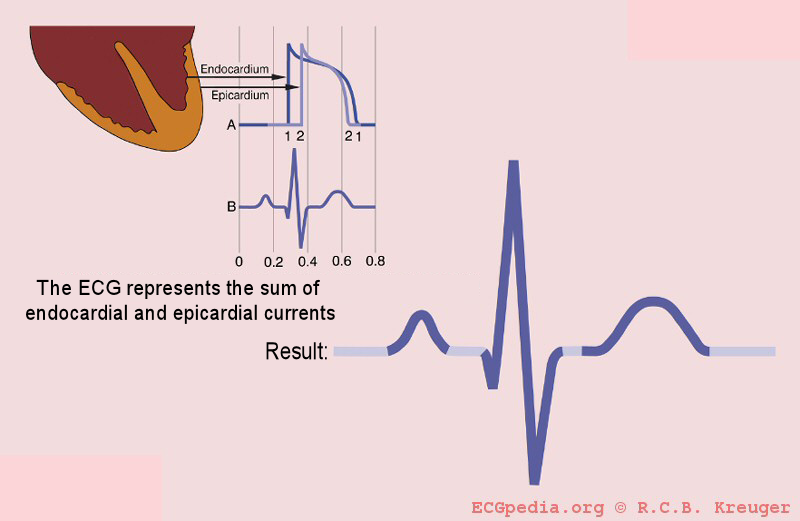 The QRS complex is formed by the sum of the electric avtivity of the inner (endocardial) and the outer (epicardial) cardiomyocytes
 -
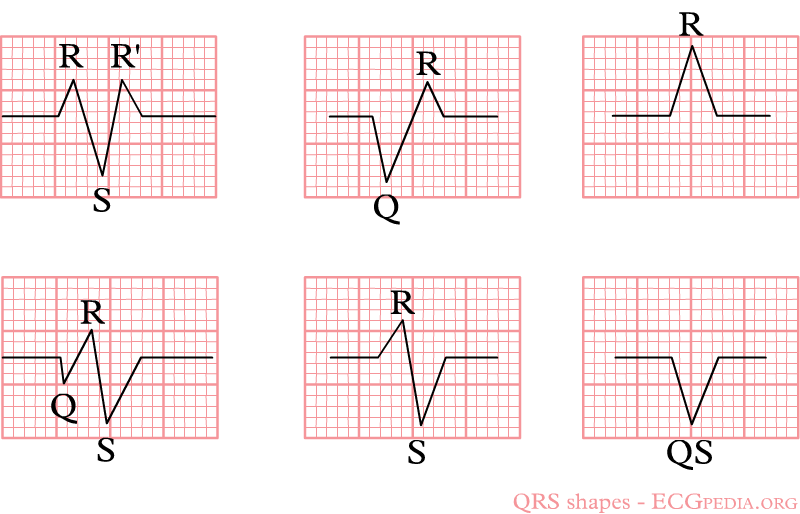 Example of the different QRS configuations


The ECG electrodes
Electric activity going through the heart, can be measured by external (skin)electrodes. The electrocardiogram (ECG) registers these activities from these electrodes which have been attached on diffrent places on the body. In total, twelve leads are calculated using ten electrodes.
The ten electrodes are:
- the extremity electrodes:
- LA - left arm
- RA - right arm
- N - neutral, on the right leg (= electrisch aarde of nulpunt ten opzichte waarvan de electrische spanning wordt gemeten)
- F - foot, on the left leg
It makes no difference whether the electrodes are attached proximal or distal on the extremities. However, it is best to be uniform in this. (eg. do not attach an electrode on the left shoulder and one on the right wrist).

- the chest electrodes:
- V1 - placed in the 4th intercostal space, right of the sternum
- V2 - placed in the 4th intercostal space, left of the sternum
- V3 - placed between V2 and V4
- V4 - placed 5th intercostal space in the nippleline. Official recommendations are to place V4 under the breast in women.Kligfield
- V5 - placed between V4 and V6
- V6 - placed in the midaxillary line on the same height as V4 (horizontal line from V4, so not necessarily in the 5th intercostal space)
Using these 10 electrodes, 12 leads can be derived. There are 6 extremity leads and 6 precordial leads.
The Extremity Leads
The extremity leads are:
- I from the right to the left arm
- II from the right arm to the left leg
- III from the left arm to the left leg
An easy rule to remember: lead I + lead III = lead II This is done with the use of the height or depth, independent of the wave (QRS, P of T). Example: if in lead I, the QrS complex is 3 mm in height and in lead III 9mm, the height of the QRS-complex in lead II is 12mm.
Other extremity leads are:
- AVL points to the left arm
- AVR points to the right arm
- AVF points to the feet
The capital A stands for "augmented" and V for "voltage".
(aVR + aVL + aVF = 0)

The Chest Leads
The precordial, or chest leads, (V1,V2,V3,V4,V5 and V6) 'observe' the depolarization wave in the frontal plane

Example: V1 is close to the right ventricle and the right atrium. Signals in these areas of the heart have the largest signal in this lead. V6 is the closest to the lateral wall of the left ventricle.
Special Leads
In case of an inferior wall infarct, extra leads may be used:
- In a right side ECG, V1 and V2 remain on the same place.V3 to V6 are placed on the same place but mirrored on the chest. So V4 is in the middle of the right clavicle. On the ECG it should be marked that it is a Right sided ECG. V4R (V4 but right sided) is a sensitive lead to diagnose right ventricular infarction.
- Leads V7-V8-V9 can be used to diagnose a posteriorinfarct. It is means that after V6, leads are placed towards the back. See the chapterIschemia for other ways of diagnosing posterior infarction.

References
- Dubois Du Bois-Reymond, E. Untersuchungen über thierische Elektricität. Reimer, Berlin: 1848.
- Hoffa Hoffa M, Ludwig C. 1850. Einige neue versuche uber herzbewegung. Zeitschrift Rationelle Medizin, 9: 107-144
- Waller Waller AD. A demonstration on man of electromotive changes accompanying the heart's beat. J Physiol (London) 1887;8:229-234
- Einthoven Einthoven W. Le telecardiogramme. Arch Int de Physiol 1906;4:132-164
- Einthoven2 Einthoven W. Über die Form des menschlichen Electrocardiogramms. Pfügers Archiv maart 1895, pagina 101-123
- Marey Marey EJ. Des variations electriques des muscles et du couer en particulier etudies au moyen de l'electrometre de M Lippman. Compres Rendus Hebdomadaires des Seances de l'Acadamie des sciences 1876;82:975-977
- Marquez PMID 12177632
- Hurst PMID 9799216
- Naming of the Waves in the ECG, With a Brief Account of Their Genesis
- Kligfield PMID 17322457
Additional resources
- ECGpedia: Course for interpretation of ECG
- The whole ECG - A basic ECG primer
- 12-lead ECG library
- Simulation tool to demonstrate and study the relation between the electric activity of the heart and the ECG
- ECG information from Children's Hospital Heart Center, Seattle
- ECG Challenge from the ACC D2B Initiative
- National Heart, Lung, and Blood Institute, Diseases and Conditions Index
- A history of electrocardiography
- EKG Interpretations in infants and children