Osborn wave

|
WikiDoc Resources for Osborn wave |
|
Articles |
|---|
|
Most recent articles on Osborn wave Most cited articles on Osborn wave |
|
Media |
|
Powerpoint slides on Osborn wave |
|
Evidence Based Medicine |
|
Clinical Trials |
|
Ongoing Trials on Osborn wave at Clinical Trials.gov Clinical Trials on Osborn wave at Google
|
|
Guidelines / Policies / Govt |
|
US National Guidelines Clearinghouse on Osborn wave
|
|
Books |
|
News |
|
Commentary |
|
Definitions |
|
Patient Resources / Community |
|
Patient resources on Osborn wave Discussion groups on Osborn wave Patient Handouts on Osborn wave Directions to Hospitals Treating Osborn wave Risk calculators and risk factors for Osborn wave
|
|
Healthcare Provider Resources |
|
Causes & Risk Factors for Osborn wave |
|
Continuing Medical Education (CME) |
|
International |
|
|
|
Business |
|
Experimental / Informatics |
Editor-In-Chief: C. Michael Gibson, M.S., M.D. [1]; Associate Editor-In-Chief: Cafer Zorkun, M.D., Ph.D. [2]
Synonyms and keywords: camel-hump sign; late delta wave; hathook junction; hypothermic wave; J point wave; K wave; H wave; current of injury; Osborne wave
Overview
Osborn waves (also known as ) are usually observed on the electrocardiogram of people suffering from hypothermia, though they may also occur in people with high blood levels of calcium (hypercalcemia), brain injury, subarachnoid hemorrhage, damage to sympathetic nerves in the neck, and cardiopulmonary arrest from over sedation, vasospastic angina, or ventricular fibrillation. [1] [2] [3] [4]
Historical Perspective
The prominent J deflection attributed to hypothermia was first reported in 1938 by Tomaszewski. The wave was observed by others, including Kossmann, Grosse-Brockhoff and Schoedel, Bigelow et al, Juvenelle et al, and Osborn. [5] [6] [7] [8]
Over the years, the unusual wave has increasingly been called an Osborn wave, probably because of Osborn's excellent descriptive article written in 1953. Clinicians labeled the deflection an Osborn wave in honor of Osborn, one of the first American Heart Association research fellows. [9] [10]
Causes
Common Causes
Causes of Osborn Waves in Alphabetical Order
- Cerebrovascular accident[11] [12]
- Coronary vasospasm
- Damage to sympathetic nerve chain in the neck after radical neck dissection [13]
- Hypercalcemia
- Hypothermia
- Subarachnoid hemorrhage[14]
- Ventricular fibrillation, immediately before and after, often in the setting of vasospastic angina
Diagnosis
Electrocardiogram
The most typical finding is the appearance of the Osborne J wave, an extra deflection between the QRS complex and the T wave. Osborn waves are positive deflections occurring at the junction between the QRS complex and the ST segment, where the S point, also known as the J joint, has a myocardial infarction-like elevation. Osborn waves are more prominent in the left precordial leads. They increases in size with decreasing temperature. They are caused by a current of injury, delayed ventricular depolarization, or early repolarization.
Osborn waves may first appear on the ECG for temperatures less tahn 91.4 degrees Fahrenheit (33 degrees Celsius), and consistently appear when when the temperature falls below 25 degrees Centigrade.
There is variability in the morphology of Osborn waves as all J wave deflections do not look alike. Some Osborn waves are merely elevations of ST segments in leads V1 and V2, whereas others are of the "spike-and-dome" variety. Given the variability in morphology, a variety of mechanisms may be responsible for the size and shape of J wave deflections.
Shown below is an example of the "spike and dome" variant of the Osborn wave:

Shown below is an Osborn wave in an 81-year-old male with a core temperature 89.5 degrees F (31.94 C):

Electrocardiographic Examples
Examples of Osborn Waves in the Setting of Hypothermia
Shown below is the 12 lead ECG of a patient with a body temperature of 32 degrees Celsius. Note the sinus bradycardia, the prolonged QT interval (QTc is not prolonged) and the Osborn J wave, most prominently in leads V2-V5:
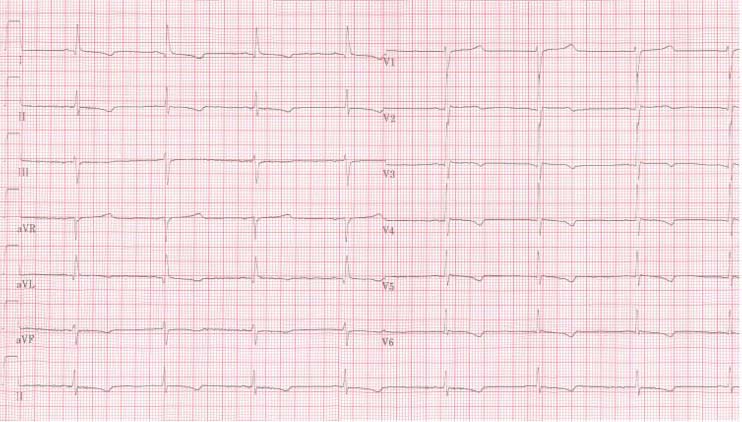
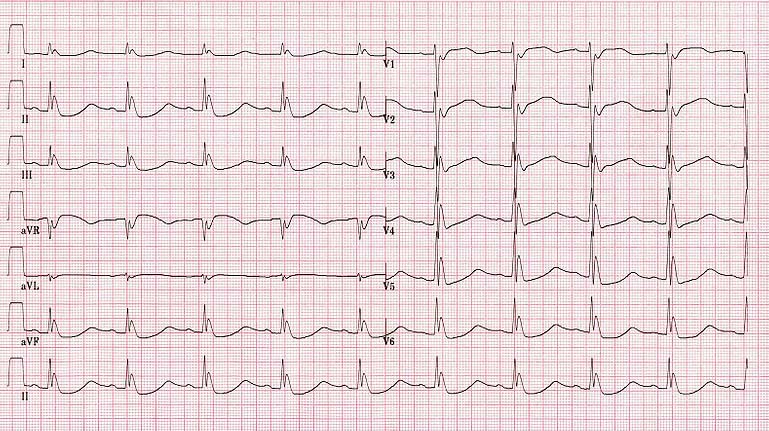
Shown below is An ECG of a patient with a body temperature of 28 degrees Celsius:
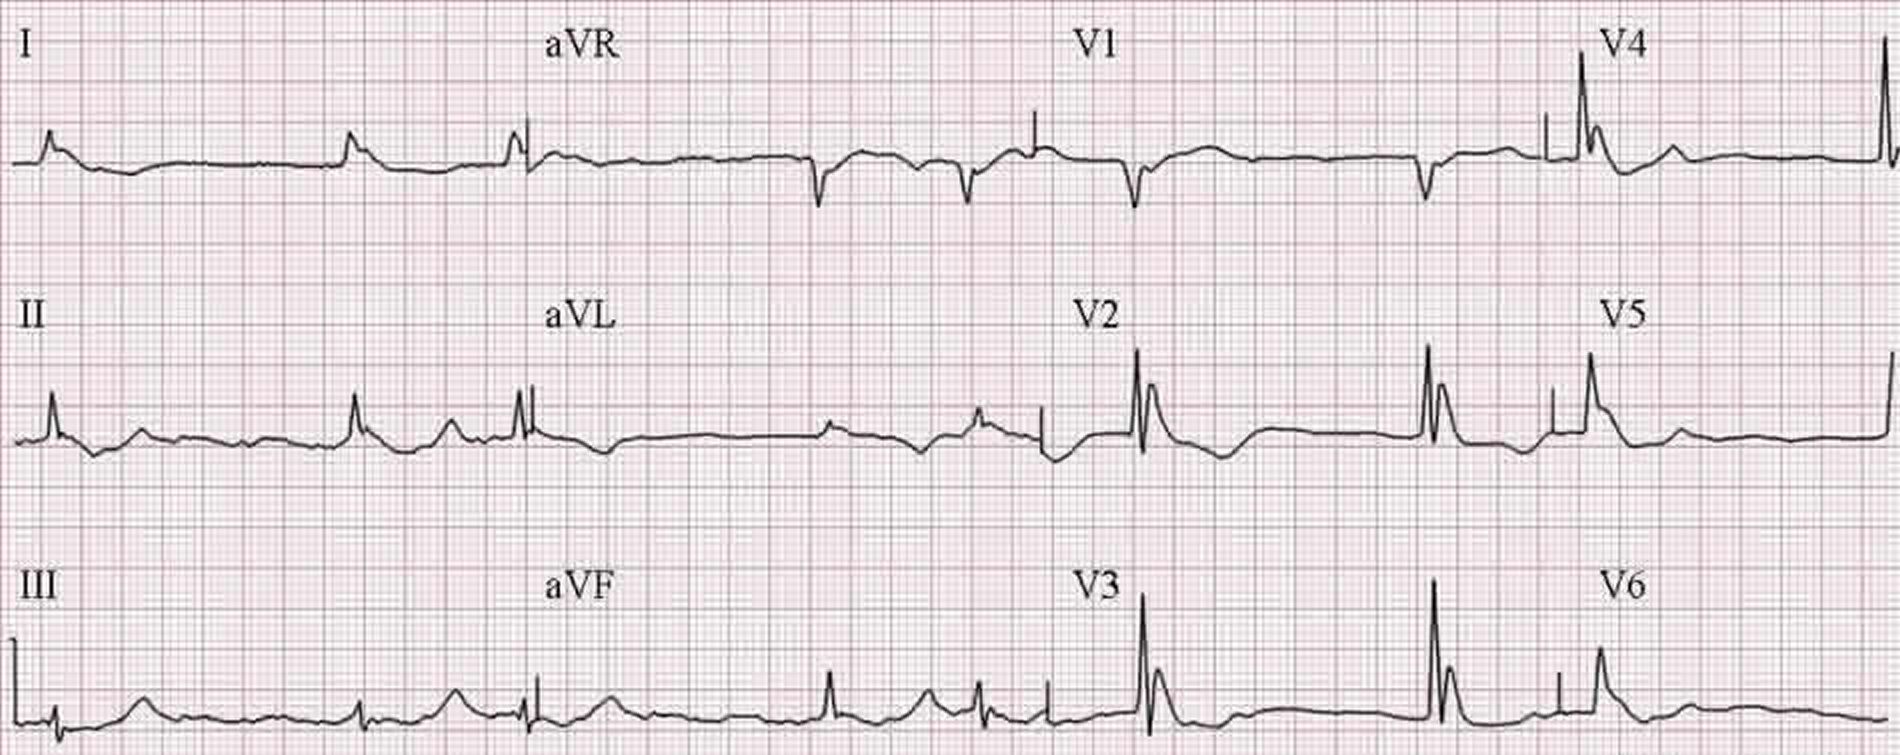
Shown below are Osborn J waves due to hypothermia:
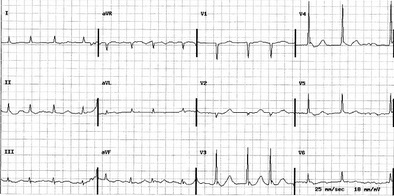
Shown below are Osborn J waves due to hypothermia:
Example of Osborn Waves in the Setting of Vasospastic Angina
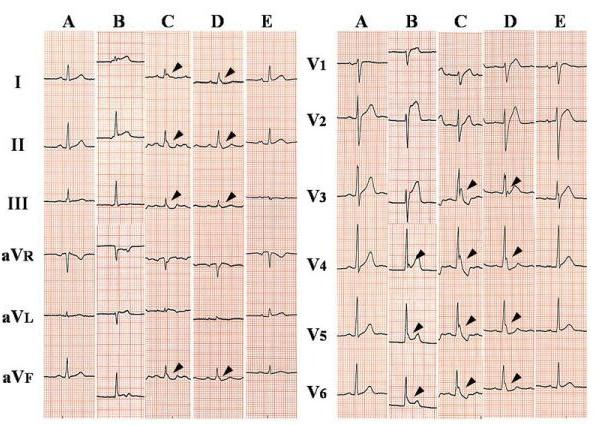
Shown below is the time course of twelve-lead ECG in a 52-year-old man with vasospastic angina. ECGs were obtained prior to the ischemic attack (A), at the onset of chest pressure (B), immediately before ventricular fibrillation (C), after defibrillation and administration of intravenous lidocaine and magnesium (D), and 2 days after the episode (E). Osborn waves (arrowheads) were best seen in the inferior and lateral leads around the occurrence of ventricular fibrillation. In contrast to hypothermic patients, the tracing shows sinus tachycardia and short QT intervals.[15]
References
- ↑ Juvenelle A, Lind J, Wegelius C. Quelques possibilitiés offertes par l'hypothermie générale profonde provoquée: une étude expérimentale chez le chien. Presse Med. 1952;60:973–978.
- ↑ Hersch C. Electrocardiographic changes in head injuries. Circulation. 1961;23:853–860.
- ↑ De Sweit J. Changes simulating hypothermia in the electrocardiogram in subarachnoid hemorrhage. J Electrocardiol. 1972;5:93–95.
- ↑ Hugenholtz PG. Electrocardiographic changes typical for central nervous system disease after right radical neck dissection. Am Heart J. 1967; 74:438–441.
- ↑ Tomaszewski W. Changements électrocardiographiques observés chez un homme mort de froit. Arch Mal Coeur. 1938;31:525–528.
- ↑ Kossmann CE. General cryotherapy: cardiovascular aspects. Bull N Y Acad Med. 1940;16:317.
- ↑ Grosse-Brockhoff F, Schoedel W. Das bild der akuten unterkuhlung im tierexperiment. Arch Exp Path Pharmakol. 1943;201:417.
- ↑ Bigelow WG, Lindsay WK, Greenwood WF. Hypothermia: its possible role in cardiac surgery: investigation of factors governing survival in dogs at low body temperatures. Ann Surg. 1950;132:849–866.
- ↑ Osborn JJ. Experimental hypothermia: Respiratory and blood pH changes in relation to cardiac function. Am J Physiol 1953; 175: 389-398.
- ↑ Maruyama, Mitsunori and Kobayashi, Yoshinori and Kodani, Eitaroh and Hirayama, Yoshiyuki and Atarashi, Hirotsugu and Katoh, Takao and Takano, Teruo. Osborn Waves: History and Significance. Indian Pacing and Electrophysiology Journal 4(1):pp. 33-39 PMID 16943886
- ↑ Juvenelle A, Lind J, Wegelius C. Quelques possibilitiés offertes par l'hypothermie générale profonde provoquée: une étude expérimentale chez le chien. Presse Med. 1952;60:973–978.
- ↑ Hersch C. Electrocardiographic changes in head injuries. Circulation. 1961;23:853–860.
- ↑ Hugenholtz PG. Electrocardiographic changes typical for central nervous system disease after right radical neck dissection. Am Heart J. 1967; 74:438–441.
- ↑ De Sweit J. Changes simulating hypothermia in the electrocardiogram in subarachnoid hemorrhage. J Electrocardiol. 1972;5:93–95.
- ↑ Maruyama M, Kobayashi Y, Kodani E, Hirayama Y, Atarashi H, Katoh T, Takano T. Osborn Waves: History and Significance. Indian Pacing and Electrophysiology Journal, 4(1): 33-39 (2004) PMID 16943886