Ebsteins anomaly of the tricuspid valve electrocardiogram
|
Ebsteins anomaly of the tricuspid valve Microchapters | |
|
Diagnosis | |
|---|---|
|
Treatment | |
|
Case Studies | |
|
Ebsteins anomaly of the tricuspid valve electrocardiogram On the Web | |
|
American Roentgen Ray Society Images of Ebsteins anomaly of the tricuspid valve electrocardiogram | |
|
FDA on Ebsteins anomaly of the tricuspid valve electrocardiogram | |
|
CDC on Ebsteins anomaly of the tricuspid valve electrocardiogram | |
|
Ebsteins anomaly of the tricuspid valve electrocardiogram in the news | |
|
Blogs on Ebsteins anomaly of the tricuspid valve electrocardiogram | |
|
Risk calculators and risk factors for Ebsteins anomaly of the tricuspid valve electrocardiogram | |
Editor-In-Chief: C. Michael Gibson, M.S., M.D. [1]; Associate Editor-In-Chief: Cafer Zorkun, M.D., Ph.D. [2]}; Claudia P. Hochberg, M.D.; Priyamvada Singh, MBBS [3] Assistant Editor-In-Chief: Kristin Feeney, B.S. [4]
Overview
The EKG is abnormal in 50 to 60% of patients, and will often show signs of right atrial enlargement, including "Himalayan" P waves which are P waves greater than 2.5 mm in height in leads 2, 3, and aVF. First-degree AV block, low QRS voltage, an atypical right bundle branch block, T wave inversions, and Wolff-Parkinson-White syndrome may also be present.
EKG Abnormalities
- Right atrial enlargement or tall and broad 'Himalayan' P waves[1][2]
- First degree atrioventricular block due to an intraatrial conduction delay with a prolonged PR-interval
- About 50% of individuals with Ebstein's anomaly have evidence of Wolff-Parkinson-White Syndrome (syndrome of pre-excitation of the ventricles due to an accessory pathway known as the Bundle of Kent), secondary to the the apical displacement of the septal tricuspid valve leaflet resulting in discontinuity of the central fibrous body. WPW has a left bundle branch pattern with predominant S waves in the right precordium as well as a short PR interval and a delta wave.
- Low amplitude QRS complexes in the right precordial leads,
- Atypical right bundle branch block
- T wave inversion in V1-V4 and Q waves in V1-V4 and II, III and aVF.
- Supraventricular tachycardia and other forms of rhythm disturbances such as atrial flutter or atrial fibrillation may be observed
Electrocardiographic Example
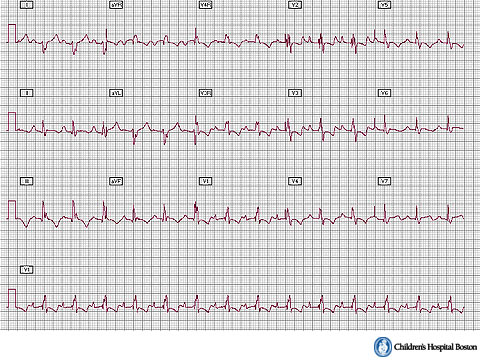
Shown below is the EKG of a woman with Ebstein's anomaly. The ECG shows signs of right atrial enlargement. The P waves in leads 2,3, and aVF are tall and greater than 2.5 mm in height. These large P waves are termed "Himalayan" P waves. There is also a right bundle branch block pattern and a first degree atrioventricular block (prolonged PR-interval) due to intra-atrial conduction delay. There is no evidence of a Kent-bundle in this patient. There is T wave inversion in V1-4 and a marked Q wave in III; these two changes are characteristic for Ebstein's anomaly and do not reflect ischemic ECG changes in this patient.

Shown below is the electrocardiogram of an adolescent with Ebstein's anomaly which demonstrates right atrial enlargement and first-degree AV block. Right Bundle Branch Block and right axis deviation are also present.

Source: http://www.childrenshospital.org/cfapps/mml/index.cfm?CAT=media&MEDIA_ID=1623
References
- ↑ VAN LINGEN B, BAUERSFELD SR (July 1955). "The electrocardiogram in Ebstein's anomaly of the tricuspid valve". Am. Heart J. 50 (1): 13–23. doi:10.1016/0002-8703(55)90250-7. PMID 14387934.
- ↑ Attenhofer Jost CH, Connolly HM, Dearani JA, Edwards WD, Danielson GK (January 2007). "Ebstein's anomaly". Circulation. 115 (2): 277–85. doi:10.1161/CIRCULATIONAHA.106.619338. PMID 17228014.