Premature atrial contraction electrocardiogram
|
Premature atrial contraction Microchapters |
|
Differentiating Premature atrial contraction from other Diseases |
|---|
|
Diagnosis |
|
Treatment |
|
Case Studies |
|
Premature atrial contraction electrocardiogram On the Web |
|
American Roentgen Ray Society Images of Premature atrial contraction electrocardiogram |
|
|
|
Risk calculators and risk factors for Premature atrial contraction electrocardiogram |
Editor-In-Chief: C. Michael Gibson, M.S., M.D. [1]; Mugilan Poongkunran M.B.B.S [2]
Overview
Premature atrial contraction may have a variety of manifestations on the electrocardiogram. The diagnosis of an PACs is made when a P wave with a morphology different from that of the sinus P wave (inverted or biphasic) occurs earlier than the anticipated sinus P wave. It is always advisory to examine each lead as subtle differences in morphology may be present.
Electrocardiogram
The presence of PACs is diagnosed based upon either an EKG, Holter, or cardiac event monitor.
- By definition the P waves are premature.
- Morphology of the P' wave is different than the P wave in normal sinus rhythm. If its origin is close to that of the sinus node, then the P' morphology is hard to distinguish from the native sinus P wave.
- A PAC differs from a premature junctional contraction (PJC) in that the PR interval is > 0.12 second in a PAC.
- The PR interval may be shorter than that in normal sinus rhythm (NSR) if it is located closer to the AV node.
- The PR interval tends to lengthen when the coupling time to the PAC is short.
- A PAC may not be conducted to the ventricles and this is called a blocked PAC.
- The differential diagnosis in this scenario includes second degree AV block. In second degree AV block, the PP intervals remain constant.
- Usually the QRS is of normal duration, but occasionally there is aberrant conduction, most frequently of right bundle branch block (RBBB) morphology.
- Aberrancy is more likely to occur when the coupling time is shorter.
- Usually there is no compensatory pause. The PAC resets the sinus node.
- Most of these patients do not have organic heart disease.
- 64% of healthy subjects will have PACs on 24 hour Holter monitoring
- Frequency higher in the elderly
- The QRS complex is normal.
- There is normal T wave repolarization (not inverted to the other T waves).
{{#ev:youtube|KPN1Jgf7hfM}}
EKG Examples
Shown below is an example of an EKG showing sinus rhythm with atrial premature beats in trigemini.

Copyleft image obtained courtesy of ECGpedia, http://en.ecgpedia.org/wiki/File:Rhythm_premature.png
Shown below is an example of an EKG showing premature atrial contractions with evident negative p-wave.

Copyleft image obtained courtesy of ECGpedia, http://en.ecgpedia.org/wiki/File:Bes.png
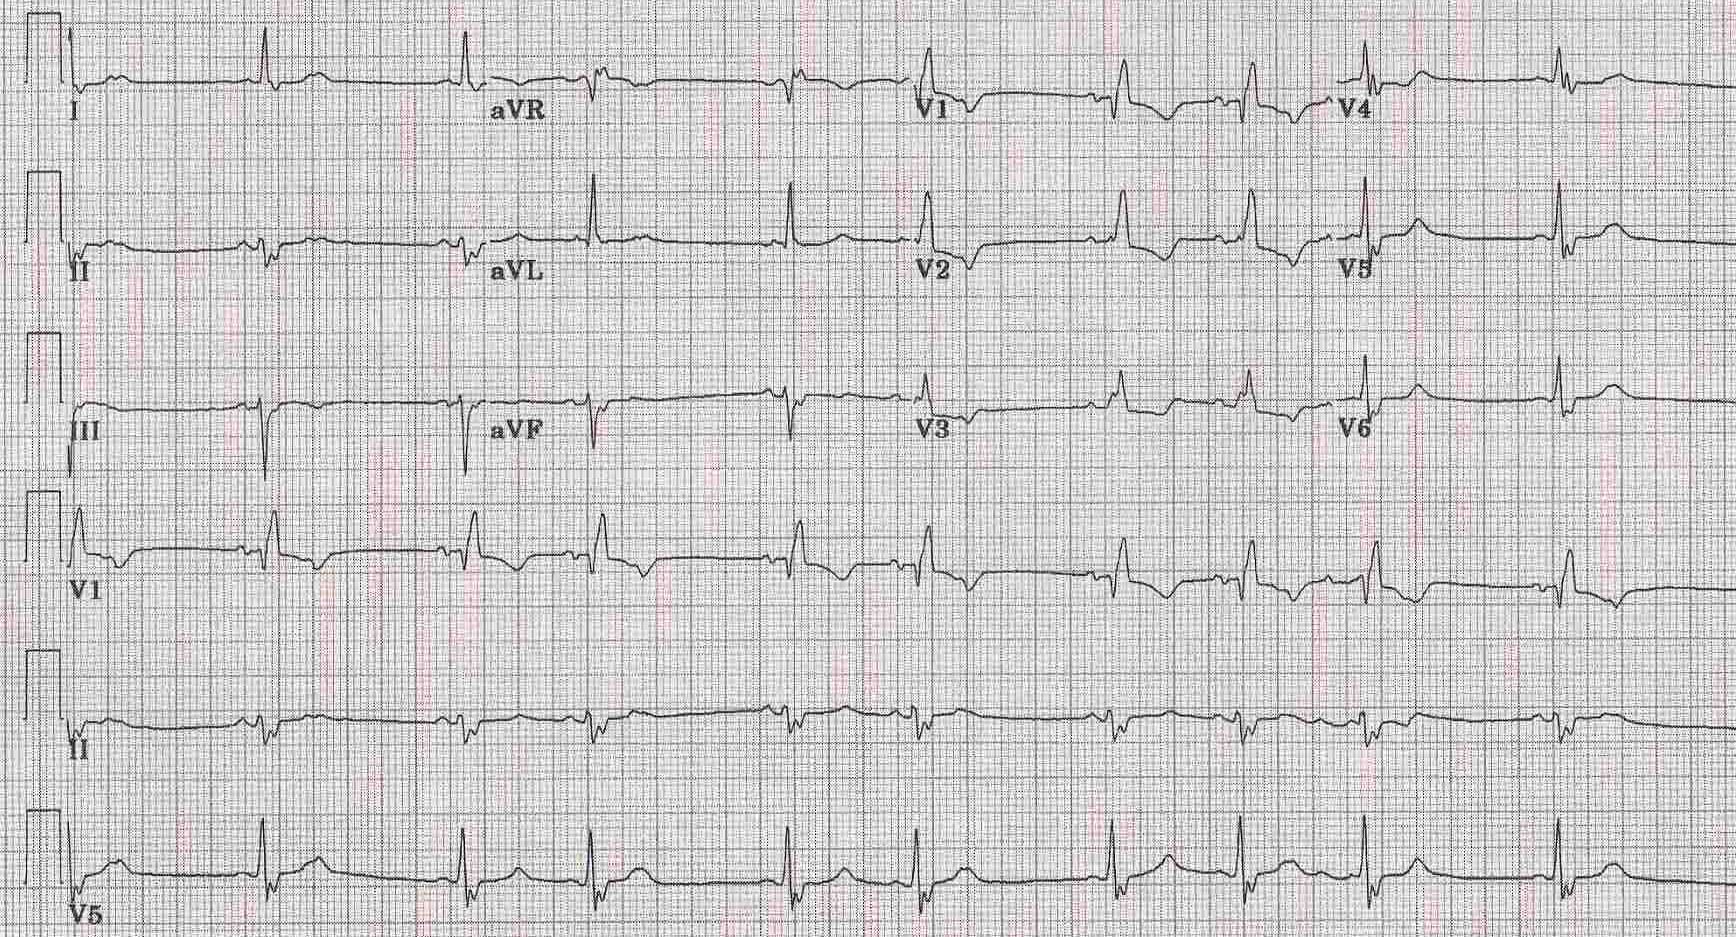
Shown below is an example of a 12 lead EKG showing premature atrial contractions in a patient with RBBB + LAFB

Copyleft image obtained courtesy of ECGpedia, http://en.ecgpedia.org/wiki/Main_Page
Shown below is an EKG showing sinus rhythm with atrial premature beats in trigemini.

Copyleft image obtained courtesy of ECGpedia, http://en.ecgpedia.org/wiki/File:E287.jpg
Shown below is an EKG showing sinus rhythm with premature atrial complexes. The P' wave can be seen deforming the T wave in the lead II rhythm strip. Note also that the atrial premature complexes reset the sinus node and hence there is no compensatory pause before the next sinus P wave. The QRS is deformed with a rsR' in V1 and a broad S in I with a duration of > 120 ms, diagnostic of aberrance with a right bundle branch morphology. The S1 Q3 and the right ward axis of the aberrant complexes suggest an additional left posterior fasicular block.

Copyleft image obtained courtesy of ECGpedia, http://en.ecgpedia.org/wiki/File:E000746.jpg
Shown below is an EKG showing an atrial premature beat (3rd beat). In fact note the QT interval of the second beat is short and in fact this was an artifact from a paper jam in the EKG recorder. The EKG also shows a first degree A/V block and abnormal Q waves in the inferior and anterior leads consistent with inferior and anterior myocardial infarction which are probably old.

Copyleft image obtained courtesy of ECGpedia, http://en.ecgpedia.org/wiki/File:E281.jpg