Lymphoplasmacytic lymphoma CT scan

Jump to navigation Jump to search

Lymphoplasmacytic lymphoma Microchapters

Home

Patient Information

Overview

Historical Perspective

Classification

Pathophysiology

Causes

Differentiating Lymphoplasmacytic Lymphoma from other Diseases

Epidemiology and Demographics

Risk Factors

Screening

Natural History, Complications and Prognosis

Diagnosis

Diagnostic Study of Choice

History and Symptoms

Physical Examination

Laboratory Findings

Electrocardiogram

X-ray

Echocardiography and Ultrasound

CT scan

MRI

Other Imaging Findings

Other Diagnostic Studies

Treatment

Medical Therapy

Surgery

Primary Prevention

Secondary Prevention

Cost-Effectiveness of Therapy

Future or Investigational Therapies

Case Studies

Case #1

Lymphoplasmacytic lymphoma CT scan On the Web

Most recent articles

Most cited articles

Review articles

CME Programs

Powerpoint slides

Images

American Roentgen Ray Society Images of Lymphoplasmacytic lymphoma CT scan

All Images
X-rays
Echo & Ultrasound
CT Images
MRI

Ongoing Trials at Clinical Trials.gov

US National Guidelines Clearinghouse

NICE Guidance

FDA on Lymphoplasmacytic lymphoma CT scan

CDC on Lymphoplasmacytic lymphoma CT scan

Lymphoplasmacytic lymphoma CT scan in the news

Blogs on Lymphoplasmacytic lymphoma CT scan

Directions to Hospitals Treating Psoriasis

Risk calculators and risk factors for Lymphoplasmacytic lymphoma CT scan

Editor-In-Chief: C. Michael Gibson, M.S., M.D. [1]; Associate Editor(s)-in-Chief: Sara Mohsin, M.D.[2]

Overview

In lymphoplasmacytic lymphoma, CT scan imaging of chest, abdomen, and pelvis may show evidences of lymphadenopathy and hepatomegaly. CT of the lungs or abdomen can also be diagnostic for infection, which is particularly relevant to immunocompromised patients.
CT scan

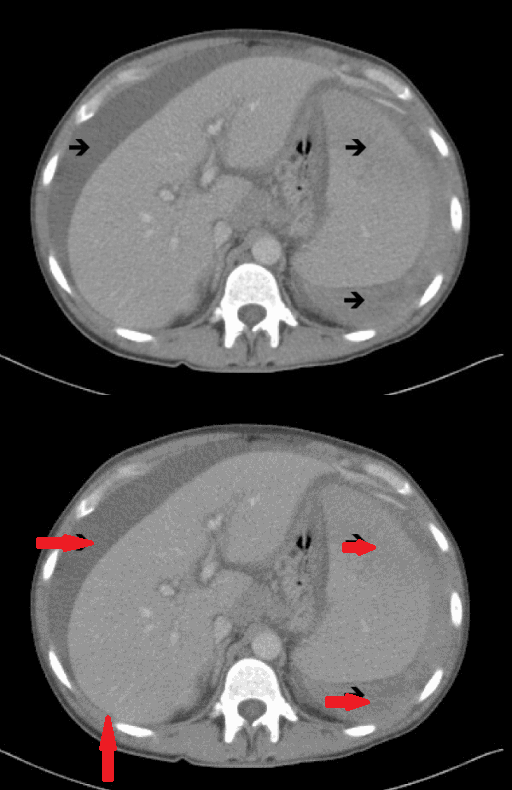
Abdominal computed tomography (CT) showing significant hemoperitoneum, with extravasation of contrast into the right flank/paracolic gutter. Hepatomegaly and splenomegaly are clearly seen. [https://openi.nlm.nih.gov/detailedresult.php?img=PMC2944189_1752-1947-4-300-7&query=waldenstrom+macroglobulinaemia&it=xg&req=4&npos=21 Source: Charakidis M. et al, Department of Haematology-Oncology, Royal Hobart Hospital, Tasmania, 7000, Australia.
]
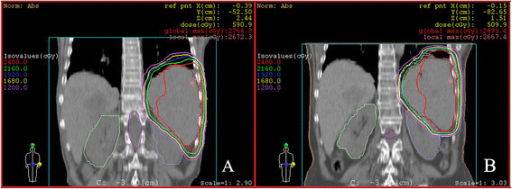
Transaxial slices representative of the isodose distribution of the 3D-CRT treatment plan delivered for the whole spleen. A, In the first stage, isodose curves were produced by 3 oblique isocentric photon fields of beam quality 10-MV; B, In the second stage, isodose curves were produced by 5 oblique isocentric photon fields of beam quality 10-MV. Source: Wei Z. et al, Department of Radiotherapy, Cancer Centre, Qilu Hospital, Shandong University, 107 Wenhuaxi Street, Jinan, Shandong 250012, China.
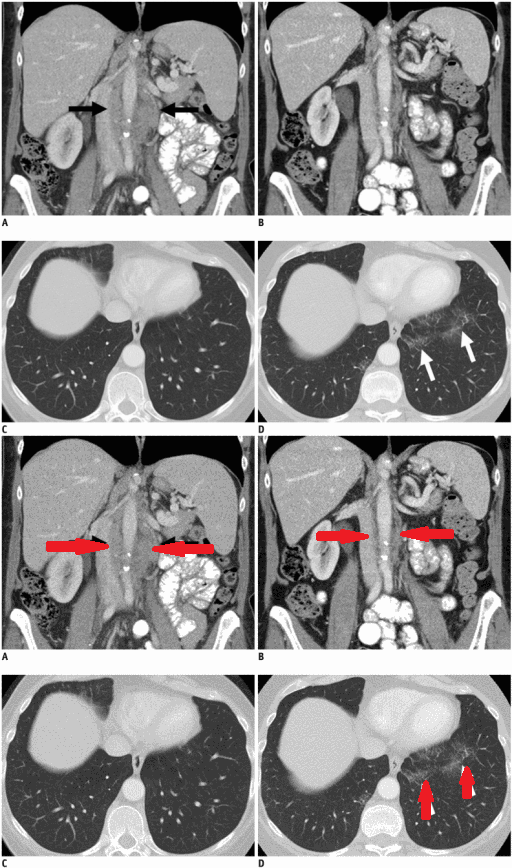
Response to mTOR-inhibitor treatment in Waldenstrom's macroglobulinemia and lung toxicity. Baseline contrast-enhanced coronal CT images in a 59-year-old woman show retroperitoneal lymphadenopathy (black arrows) and mild splenomegaly (A). Five months after the start of treatment, coronal contrast-enhanced CT shows decreased adenopathy and splenomegaly (B). At baseline, clear lung bases were present (C). On a five-month follow-up CT (D), new ground-glass and reticular opacities developed in lung bases (white arrows), in keeping with mTOR-associated pneumonitis. The patient was asymptomatic. mTOR = mammalian target of rapamycin.[https://openi.nlm.nih.gov/detailedresult.php?img=PMC5240491_kjr-18-28-g007&query=waldenstrom+macroglobulinaemia&it=xg&req=4&npos=36 Source: Krajewski KM. et al, Department of Imaging, Dana-Farber Cancer Institute, Boston, MA 02215, USA.; Department of Radiology, Brigham and Women's Hospital, Boston, MA 02115, USA
]
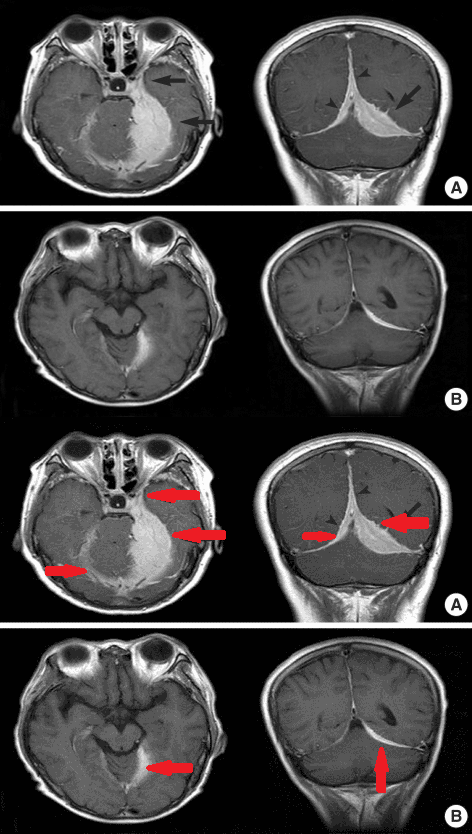
(A) Contrast-enhanced axial and coronal T1-weighted images show a well-enhanced mass along the left tentorium and cavernous sinus (arrows). This mass also extends into the contralateral tentorium and falx (arrowheads). (B) A marked decrease in the size of the mass in the tentorium and falx after radiation therapy and fludarabine treatment.[https://openi.nlm.nih.gov/detailedresult.php?img=PMC2694623_jkms-22-1079-g001&query=waldenstrom+macroglobulinaemia&it=xg&req=4&npos=28 Source: Kim HD. et al, Department of Internal Medicine, Yeoungnam University College of Medicine, Daegu, Korea.
]
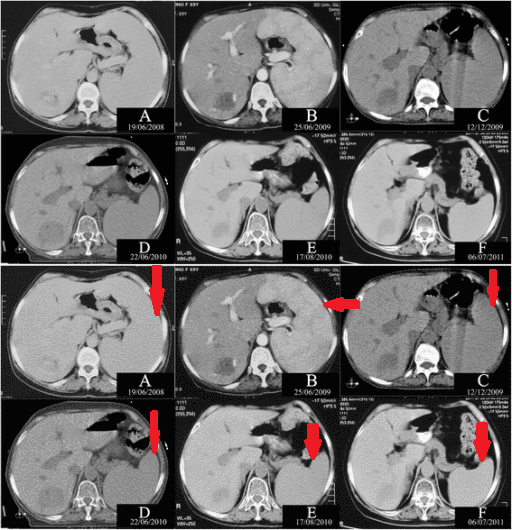
Sequential computed tomography scan images at the same level. A, At the diagnosis of the disease (19/06/2008); B, Relapsed after chlorambucil and thalidomide (25/06/2009); C, Before the first stage of 3D-CRT (12/12/2009); D, Before the second stage of 3D-CRT (22/06/2010); E, At one month after the second stage of 3D-CRT (17/08/2010); F, At one year after the second stage of 3D-CRT (06/07/2011). [https://openi.nlm.nih.gov/detailedresult.php?img=PMC3428667_1748-717X-7-58-1&query=waldenstrom+macroglobulinaemia&it=xg&req=4&npos=55 Source: Wei Z. et al, Department of Radiotherapy, Cancer Centre, Qilu Hospital, Shandong University, 107 Wenhuaxi Street, Jinan, Shandong 250012, China.
]

References

  1. 1.0 1.1 Banwait R, O'Regan K, Campigotto F, Harris B, Yarar D, Bagshaw M, Leleu X, Leduc R, Ramaiya N, Weller E, Ghobrial IM (2011). "The role of 18F-FDG PET/CT imaging in Waldenstrom macroglobulinemia". Am. J. Hematol. 86 (7): 567–72. doi:10.1002/ajh.22044. PMID 21681781.
  2. Saboo SS, Krajewski KM, O'Regan KN, Giardino A, Brown JR, Ramaiya N; et al. (2012). "Spleen in haematological malignancies: spectrum of imaging findings". Br J Radiol. 85 (1009): 81–92. doi:10.1259/bjr/31542964. PMC 3473934. PMID 22096219.

Template:WH Template:WS