Tuberculosis epidemiology and demographics: Difference between revisions
Joao Silva (talk | contribs) (→Age) |
Joao Silva (talk | contribs) (→Race) |
||
| Line 128: | Line 128: | ||
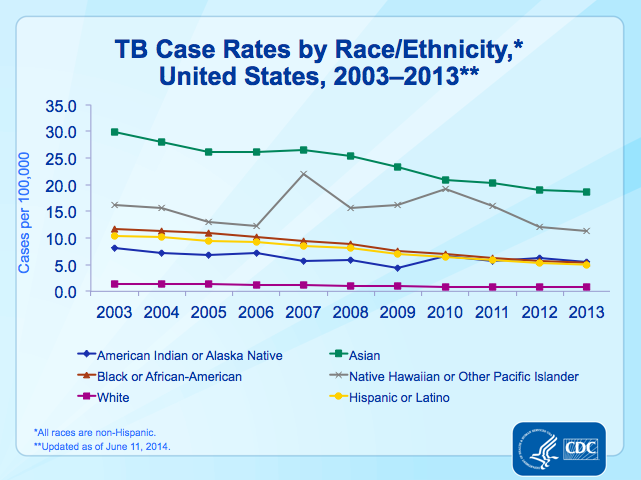
*Image 7 shows a declining trend in [[TB]] rates by race/ethnicity during the last 12 years.<ref name=CDC>{{cite web | title = Tuberculosis (TB) | url = http://www.cdc.gov/tb/statistics/surv/surv2013/default.htm }}</ref> | *Image 7 shows a declining trend in [[TB]] rates by race/ethnicity during the last 12 years.<ref name=CDC>{{cite web | title = Tuberculosis (TB) | url = http://www.cdc.gov/tb/statistics/surv/surv2013/default.htm }}</ref> | ||
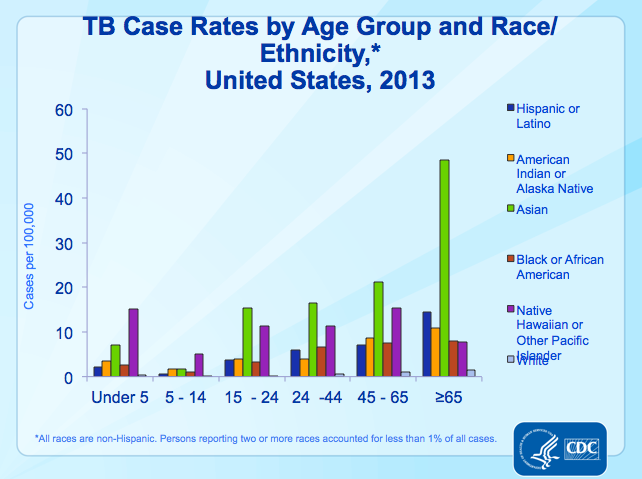
* | *Image 8 shows that after infancy (age under 5), there is an increased risk of TB with age across all racial and ethnic groups. Rates were consistently higher in minority racial and ethnic groups than in non-Hispanic whites, and were highest in Asians, Native Hawaiians and Other Pacific Islanders, particularly in the adult age groups.<ref name=CDC>{{cite web | title = Tuberculosis (TB) | url = http://www.cdc.gov/tb/statistics/surv/surv2013/default.htm }}</ref> | ||
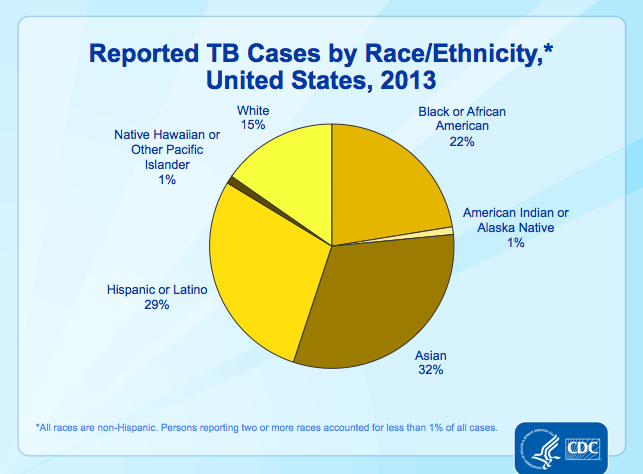
* | *Image 9 shows that in 2013, 83% of all reported TB cases occurred in racial and ethnic minorities, whereas 15% of cases occurred in non-Hispanic whites. Persons reporting two or more races accounted for 2% of all cases<ref name=CDC>{{cite web | title = Tuberculosis (TB) | url = http://www.cdc.gov/tb/statistics/surv/surv2013/default.htm }}</ref> | ||
{| | {| | ||
Revision as of 19:13, 16 September 2014
|
Tuberculosis Microchapters |
|
Diagnosis |
|---|
|
Treatment |
|
Case Studies |
|
Tuberculosis epidemiology and demographics On the Web |
|
American Roentgen Ray Society Images of Tuberculosis epidemiology and demographics |
|
Risk calculators and risk factors for Tuberculosis epidemiology and demographics |
Editor-In-Chief: C. Michael Gibson, M.S., M.D. [1]; Associate Editor(s)-in-Chief: João André Alves Silva, M.D. [2]
Overview
Tuberculosis, or TB is a bacterial infection that constitutes one of the world's deadliest diseases. In 2012, about 8.6 million people developed symptomatic TB and 1.3 million people died from the disease. In 2013 there were 9 582 reported cases in the United States, with a case rate of 3.0 per 100 000 persons.
Epidemiology
Tuberculosis is one of the world's deadliest diseases. Since 1990, the mortality rate of TB decreased 45%, and the 2015 global target is a 50% reduction of this rate. It is estimated that about 1/3 of the world's population is infected with TB:[1][2]
- In 2012 about 8.6 million people developed symptomatic TB
- 1.1 million of these cases occurred among people with HIV
- 1.3 million people died from TB
- 320 000 of these cases occurred among people with HIV
In the United States, a total of 9 582 cases were reported in 2013. This represents an incidence of 3.0 cases per 100 000 persons.[1][2]
Compared to 2012, both the number of TB cases reported and the case rate have decreased, 5.4% and 6.1%, respectively.[1][2]
TB Infection Rate in the US
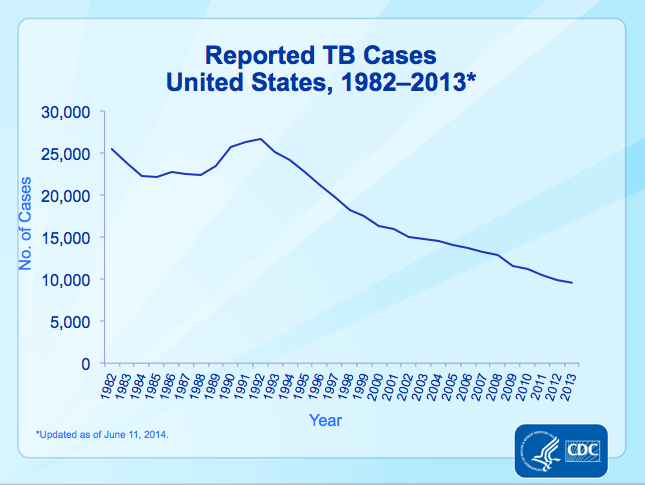
Since the 1992 TB resurgence peak in the United States, the number of TB cases reported annually has decreased.[1]
After the resurgence of TB in the mid-1980s, the number of case counts increased until its peak in 1992. After 1993, the number of case counts began to decrease, and 2013 marked the twenty-first year of decline in the total number of TB cases reported in the United States since the peak of the resurgence. In 2013, a total of 9,582 cases were reported from the 50 states and the District of Columbia (DC). This represented a decline of 3.6% from 2012 and 64.1% from 1992.[1]
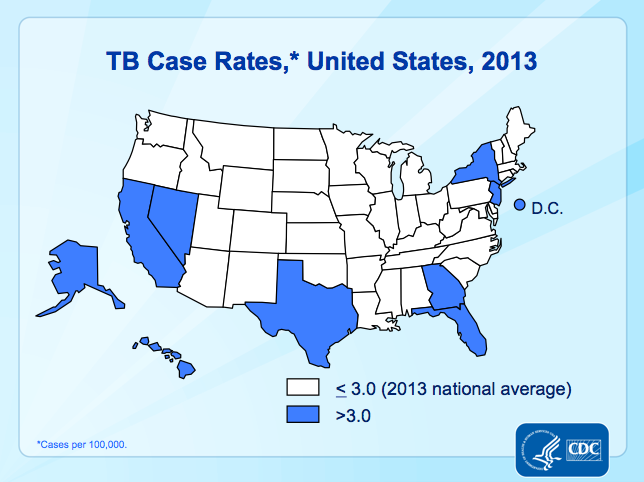
Thirty-seven states reported a rate less than 3.0 TB cases per 100,000, the 2013 national average. Fourteen states and DC reported a rate above 3.0 TB cases per 100,000; these accounted for 69% of the national total in 2013 and have experienced substantial overall decreases in cases and rates from 1992 through 2013.[1]
 |
 |

Age
An estimated 530 000 children became ill with TB and 74 000 children who were HIV-negative died of TB in 2012.[1][2]
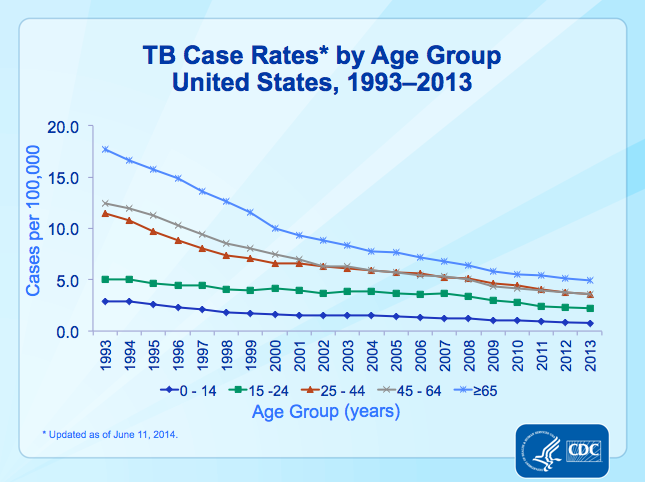
In 2013, case rates in all age groups declined by more than 50% from the 1993 values. Below is the comparison between the case rates (per 100 000 persons) of these two years, according to different ages:[1]
| Age | Case rate in 1993 | Case rate in 2013 |
|---|---|---|
| >65 years | 17.7 | 4.9 |
| 45 - 64 years | 12.4 | 3.6 |
| 25 - 44 years | 11.5 | 3.6 |
| 15 - 24 years | 5.0 | 2.2 |
| < 15 years | 2.9 | 0.8 |
| Data provided by the CDC[1][2] | ||
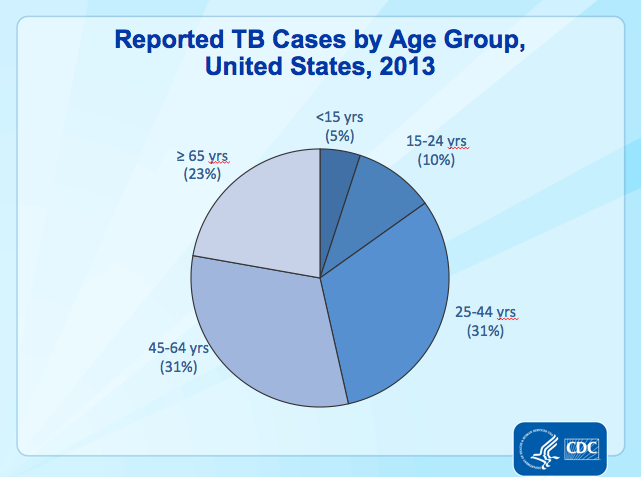
Below, image 4 shows the TB case rates, according to the age group in the United States, between the years of 1993 and 2013; while image 5 shows the age distribution of persons who were reported with TB in 2013, in the United States:[1]
 |
 |
Gender
410 000 women died from TB in 2012, including 160 000 among women who were HIV-positive. Of the overall TB deaths among HIV-positive people, 50% were among women. TB is one of the top killers of women of reproductive age.[1][2]
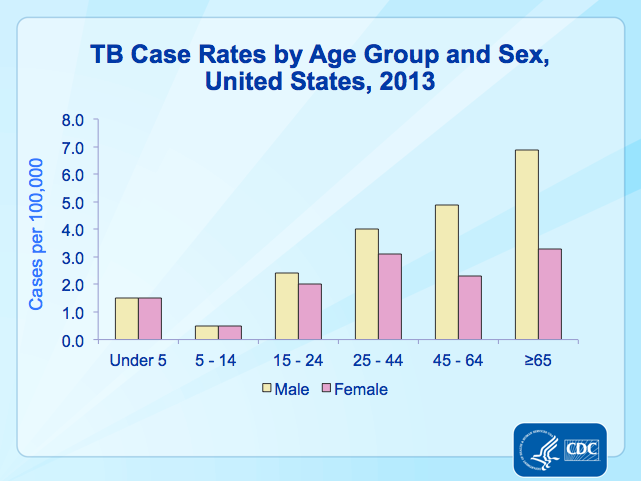
Below is a graphic showing the TB rates in 2013 by age group and sex. It shows that rates tended to increase with age, ranging from a low, of less than 1 per 100,000 in children aged 5 - 14 to a high of 6.9 per 100,000 in men 65 years and older. As age increased, the case rate in men increased faster than women; the rates in men 45 years and older were approximately more than twice those in same-age women.[1][2]
Race
Asians had the highest TB rates, which declined from 29.9 per 100,000 persons in 2003 to 18.7 in 2013, and had a decline over the same time period of 37%.[1]
| Racial/ethnic groups | Case rate in 2003 | Case rate in 2013 |
|---|---|---|
| Non-Hispanic blacks or African-Americans | 11.7 | 5.4 |
| Hispanics | 10.3 | 5.0 |
| American Indians and Alaska Natives | 8.2 | 5.4 |
| Non-Hispanic whites | 1.4 | 0.7 |
| Native Hawaiian or Other Pacific Islanders | 16.2 | 11.3 |
| Data provided by the CDC[1][2] | ||
Several important factors likely contribute to the disproportionate burden of TB in minorities. In persons who were born in countries where TB is common, the disease may result from infection acquired in the country of origin. Unequal distribution of TB risk factors, such as HIV infection, may also contribute to increased exposure to TB or to an increased risk of developing TB once infected with M. tuberculosis.[1]
- Image 8 shows that after infancy (age under 5), there is an increased risk of TB with age across all racial and ethnic groups. Rates were consistently higher in minority racial and ethnic groups than in non-Hispanic whites, and were highest in Asians, Native Hawaiians and Other Pacific Islanders, particularly in the adult age groups.[1]
- Image 9 shows that in 2013, 83% of all reported TB cases occurred in racial and ethnic minorities, whereas 15% of cases occurred in non-Hispanic whites. Persons reporting two or more races accounted for 2% of all cases[1]
 |
 |
 |
HIV Coinfection
TB is a leading killer of people who are infected with HIV. In 2012, 46% of notified TB patients had a documented HIV test result. Africa has the highest TB/HIV burden, where three out of four TB patients know their HIV status. In 2012, 4.1 million people enrolled in HIV care were screened for TB, up from 3.5 million in 2011. Globally, 57% of the TB patients known to be living with HIV in 2012 were started on antiretroviral therapy (ART).[1][2]