How to read an ECG: Difference between revisions
Rim Halaby (talk | contribs) |
Rim Halaby (talk | contribs) (/* Causes of ST elevation{{cite journal| author=Wang K, Asinger RW, Marriott HJ| title=ST-segment elevation in conditions other than acute myocardial infarction. | journal=N Engl J Med | year= 2003 | volume= 349 | issue= 22 | pages= 2128-35 | pmid...) |
||
| Line 268: | Line 268: | ||
*An important clue for the diagnosis of ischemia is the presence of [[Ischemia|reciprocal ST segment depression]]. | *An important clue for the diagnosis of ischemia is the presence of [[Ischemia|reciprocal ST segment depression]]. | ||
====Causes of ST elevation<ref name="pmid14645641">{{cite journal| author=Wang K, Asinger RW, Marriott HJ| title=ST-segment elevation in conditions other than acute myocardial infarction. | journal=N Engl J Med | year= 2003 | volume= 349 | issue= 22 | pages= 2128-35 | pmid=14645641 | doi=10.1056/NEJMra022580 | pmc= | url=http://www.ncbi.nlm.nih.gov/entrez/eutils/elink.fcgi?dbfrom=pubmed&tool=sumsearch.org/cite&retmode=ref&cmd=prlinks&id=14645641 }} </ref>:==== | ====Causes of ST elevation<ref name="pmid14645641">{{cite journal| author=Wang K, Asinger RW, Marriott HJ| title=ST-segment elevation in conditions other than acute myocardial infarction. | journal=N Engl J Med | year= 2003 | volume= 349 | issue= 22 | pages= 2128-35 | pmid=14645641 | doi=10.1056/NEJMra022580 | pmc= | url=http://www.ncbi.nlm.nih.gov/entrez/eutils/elink.fcgi?dbfrom=pubmed&tool=sumsearch.org/cite&retmode=ref&cmd=prlinks&id=14645641 }} </ref>:==== | ||
''In alphabetical order'' | |||
*Early repolarization | *Early repolarization | ||
*[[Acute pericarditis]]: ST elevation in all leads except aVR | *[[Acute pericarditis]]: ST elevation in all leads except aVR | ||
Revision as of 18:05, 26 October 2012
Editor-In-Chief: C. Michael Gibson, M.S., M.D. [1]; Assistant Editor(s)-in-Chief: Rim Halaby
Overview
- The interpretation of an ECG should be done in a consistent step-by-step way. Each ECG should be evaluated for the following:
- Rhythm
- Rate
- Conduction
- PR interval
- QRS duration
- QT duration
- Heart axis
- P wave morphology
- QRS morphology
- ST morphology
- Compare the current ECG to previous ECG
Rhythm
- The sinus node (SA), located in the roof of the right atrium, is the fastest physiological pacemaker. When the sinus node generates an electrical impulse, the surrounding cells of the right atrium depolarize. Then the depolarization wave spreads to the cells of the left atrium, the AV (atrioventricular) node, the bundle of His and then to the ventricles through the purkinje fibers.
- In order to evaluate the rhythm, several parameters must be checked:
- The presence of a P wave
- A rhythm is sinus when every P wave is always followed by a QRS wave
- P wave is absent in atrial fibrillation, junctional or ventricular rhythm
- The P wave morphology
- The P wave corresponds to atrial contraction
- Normal P waves are similar in shapes in the same lead
- Variable morphologies of P waves in a single ECG lead is suggestive of an ectopic pacemaker rhythm such as wandering pacemaker or multifocal atrial tachycardia
- The maximum height of the P wave is 2.5 mm in II and/or III
- The regularity of the waves
- The distance between two R waves, called RR interval, is constant in a regular rhythm
- When the RR interval is not constant, the rhythm is said irregular. When the rhythm is irregularly irregular it is a sign of the presence of atrial fibrillation.
- The presence of a P wave
- Below is an ECG showing normal sinus rythm.
-
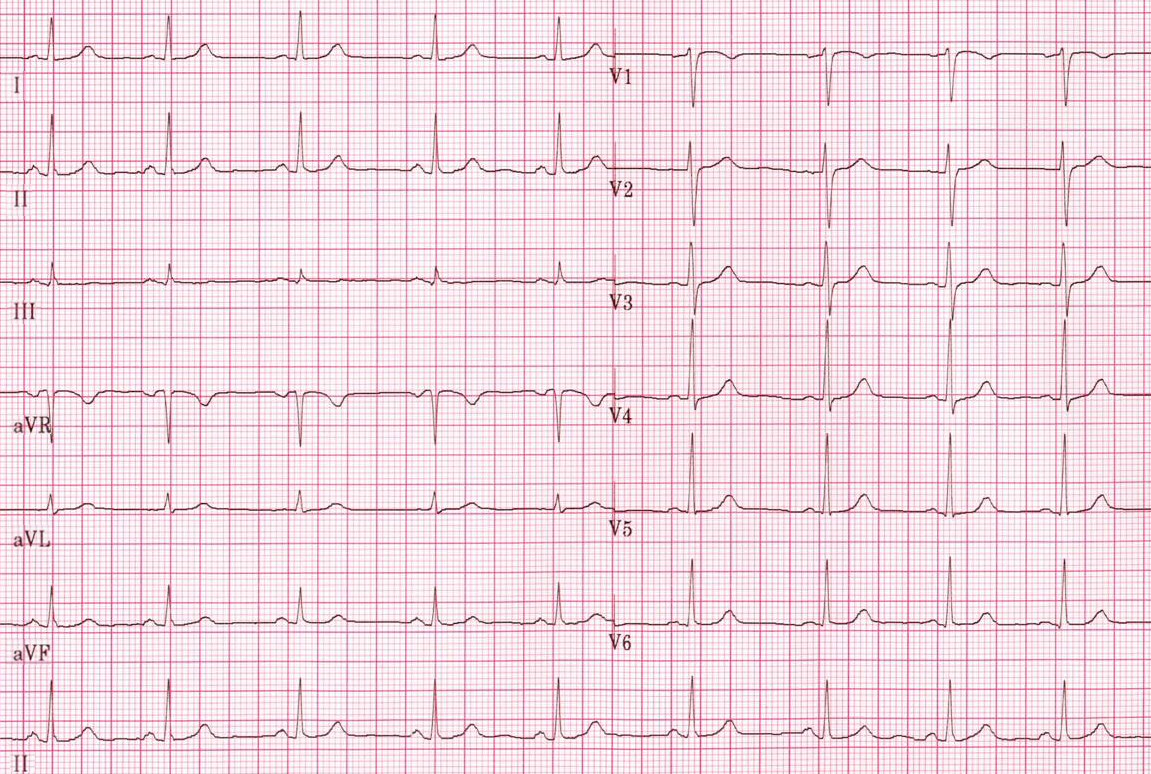
Normal sinus rhythm.

Rate
- The normal heart rate is between 60 and 100 beats per minutes
- A heart rate less than 60 or larger than 100 is called bradycardia and tachycardia respectively
- It is important to remember the temporal significance of the small and large squares on an ECG strip. See the picture below for a detailed explanation:
- Below is an image showing the significance of small and large squares in an ECG paper.

- Determining the heart rate can be done using one of these three methods:
- First method: Counting the squares
- Use the sequence 300-150-100-75-60-50-43-37. Count from the first QRS complex, the first thick line is 300, the next thick line 150 etc. Stop the sequence at the next QRS complex. When the second QRS complex is between two lines, take the mean of the two numbers from the sequence
- Below is an image showing the squares counting method used to calculate the heart rate.

- Second method:
- The ECG paper runs at 25 mm/sec through the ECG printer; therefore heart rate can be calculate using the following formula:
![]()
- Third method:
- Count the number of QRS complexes that fit into 3 seconds (some ECG writers print this period on the ECG paper). Multiply this number by 20 to find the number of beats/minute.
Evaluation of the Conduction
The evaluation of the conduction requires the evaluation of the PR interval, QRS duration and QT interval.
PR Interval
- The PR interval is measured from the beginning of the P wave to the beginning of the QRS complex.
- The PR interval reflects the time the electrical impulse takes to travel from the sinus node through the AV node where it enters the ventricles. The PR interval is therefore a good estimate of AV node function.
- The PR interval is normally between 120 to 200 ms long (3 to 5 small boxes).
- A long PR interval (of over 200 ms) may indicate a first-degree heart block or electrolyte disturbances (for example hypokalemia)
- A variable PR interval may indicate other types of heart block.
- Mobitz 1
- Mobitz 2
- Third degree heart block
- A short PR interval may indicate a pre-excitation syndrome via an accessory pathway that leads to early activation of the ventricles, such as seen in Wolf Parkinson White syndrome
The Duration of QRS
- The QRS duration indicates how fast the ventricles depolarize.
- The normal QRS is < 0.10 seconds
- When the QRS duration is longer than 110 miliseconds, a conduction delay is present.
- Possible causes of a QRS duration > 110 miliseconds include:
- Left bundle branch block
- Right bundle branch block
- Electrolyte disorders
- Idioventricular rhythm and paced ryhtm
- Possible causes of a QRS duration > 110 miliseconds include:
- For the diagnosis of LBBB or RBBB QRS duration must be >120 ms.
The QT Interval
- The QT interval indicates how fast the ventricles are repolarized, becoming ready for a new cycle.
- The QT interval comprises the QRS-complex, the ST-segment, and the T-wave. One difficultly of QT interpretation is that the QT interval gets shorter as the heart rate increases. This problem can be solved by correcting the QT time for heart rate .
- Calculation of QTc using the tangent method:
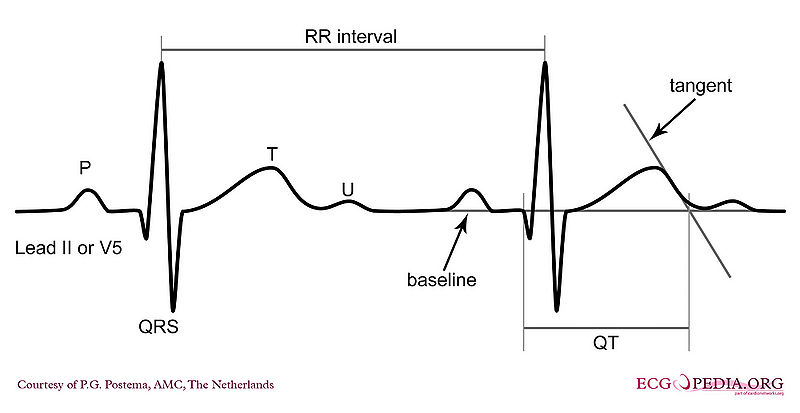
- Use lead II. Use lead V5 alternatively if lead II cannot be read.
- Draw a line through the baseline (preferably the PR segment)
- Draw a tangent against the steepest part of the end of the T wave. If the T wave has two positive deflections, the taller deflection should be chosen. If the T wave is biphasic, the end of the taller deflection should be chosen.
- The QT interval starts at the beginning of the QRS interval and ends where the tangent and baseline cross.
- Calculation of QTc using Bazett’s equation:
- Calculation of QTc using the tangent method:
- The normal value for QTc (corrected QT interval) is: below 450ms for men and below 460ms for women.
- If QTc is < 340ms short QT syndrome can be considered.
- The QT interval is prolonged in congenital long QT syndrome, but QT prolongation can also occur be acquire as a results of:
- Medication (anti-arrhythmics, tricyclic antidepressants, phenothiazedes, …)
- Electrolyte imbalances
- Ischemia

Cardiac Axis
Estimation of the Cardiac Axis
- The cardiac axis is an imaginary vector corresponding to the average of the different depolarization vectors in the heart. The depolarization wave begins in the right atrium and spread to the left and right ventricle. Because the left ventricle wall muscle mass is larger than the right wall muscle mass, the arrow representing the direction of the depolarization wave is directed towards the left.
- The normal depolarization vector is directed towards leads I, II and III. Hence, the deflections in these leads are positive in such a way that the deflection in lead II is more positive than that in leads I and III.
- The shapes of the QRS complex in leads I, II ad III are used to estimate the cardiac axis.
- Keep in mind that:
- When the depolarization is directed towards the lead, the ECG recording in that lead will show positive deflection.
- When the depolarization is directed away from the lead, the ECG recording in that lead will show negative deflection.
- A positive deflection is defined as the QRS having a larger 'area under the curve' above the baseline than below the baseline
- The normal cardiac axis lies between the angles: -30 and +90 degrees.

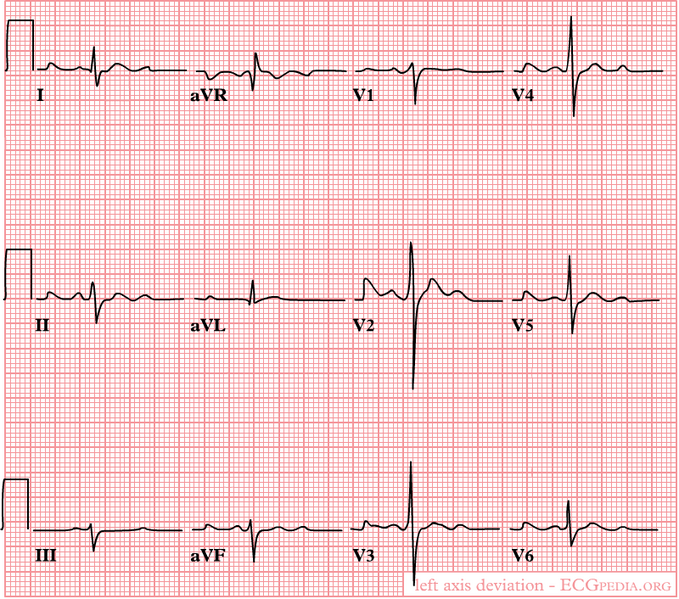
- A normal cardiac axis along with the different wave forms in leads I, II and III are represented in the image below:

- For example, if right axis deviation is present the axis will be tilted towards the right. Hence, the axis will be going away from lead I and thus R will be smaller than S in lead I and the axis will be going more towards lead III and thus R will be larger than S in lead III.
- If R is equal to S in lead II, then it is expected that the cardiac axis lies at a right angle from lead II. Hence, the cardiac axis would be either at an angle of -30 degrees or +150 degrees. The shape of the QRS complex, whether positively or negatively deflected, helps in determining the direction of the cardiac axis. A right cardiac axis deviation along with the different wave forms in leads I, II and III are represented in the image below:

To Sum It Up, Remember the Following:
- A left heart axis(between -30 and -90 degrees) is present when the QRS in lead I is positive and negative in II and III.
- A right heart axis(between +90 and +180) is present when lead I is negative and III positive.
- When the depolarization is perpendicular on the lead, this is called iso-electric. The QRS is neither positive nor negative.
-
A left heart axis is present when the QRS in lead I is positive and negative in II and III.
-
A right heart axis is present when lead I is negative and III positive.


Interpretation of an Abnormal Cardiac Axis
- 1- Actual rotation of the heart: When the heart itself is rotated (right ventricular overload), obviously the axis turns with it.
- The picture below illustrates heart axis deviation to the right in right ventricular load, as in COPD or pulmonary embolism. A right axis is between +90 and +180 degrees. In this case the axis is +135 degrees
-
Right axis deviation

- 2- Ventricular hypertrophy: The axis will deviate towards the greater electrical activity and the vector will turn towards the hypertrophied tissue.
- 3- Infarcted tissue: An infarcted tissue is electrically dead and thus no electrical activity is registered and the QRS vector turns away from the infarcted tissue
- The picture below illustrates heart axis deviation to the left in case of an inferior infarct. Left anterior hemiblock is a common cause. A left axis is between -30 and -90 degrees. The axis is -30 degrees.
-
Left axis deviation in the case of an inferior infarct

- 4- Conduction problems: When RBBB is present the right ventricle depolarizes later than the left ventricle. In a normal situation the vector is influenced by the left ventricle, but in RBBB only the right ventricle determines it.
Causes of Left Axis Deviation
- Normal variation (physiologic, often with age)
- Mechanical shifts, such as expiration, high diaphragm (pregnancy, ascites, abdominal tumor)
- Left ventricular hypertrophy
- Left bundle branch block
- Left anterior fascicular block
- Congenital heart disease (e.g. atrial septal defect)
- Emphysema
- Hyperkalemia
- Ventricular ectopic rhythms
- Preexcitation syndromes
- Inferior myocardial infarction
- Pacemaker rhythm
Causes of Right Axis Deviation
- Normal variation (vertical heart with an axis of 90º)
- Mechanical shifts, such as inspiration and emphysema
- Right ventricular hypertrophy
- Right bundle branch block
- Left posterior fascicular block
- Dextrocardia
- Ventricular ectopic rhythms
- Preexcitation syndromes
- Lateral wall myocardial infarction
- Right ventricular load, for example Pulmonary Embolism or Cor Pulmonale (as in COPD)
The P Wave Morphology
Evaluation of the P wave
The P wave represents atrial depolarization (stimulation). At rapid rates, the P wave may merge with the preceding T wave and become difficult to identify.
The evaluation of the P wave should include the following:
1. Examination of the P wave contour
- The P wave contour is normally smooth, and is either entirely positive or entirely negative wave (monophasic wave) in all leads except V1.

2. Measurement of the P wave duration
- The P wave duration is normally less than 0.12 seconds
- Widened P waves can be a sign of Class Ia antiarrhythmic drugs intoxication (quinidine, etc.) and small or absent P waves can be a sign of hyperkalemia.
3. Measurement of the maximal P wave amplitude
- The maximal P-wave amplitude is normally no more than 0.2 mV in the frontal plane leads and no more than 0.1 mV in the transverse plane leads.
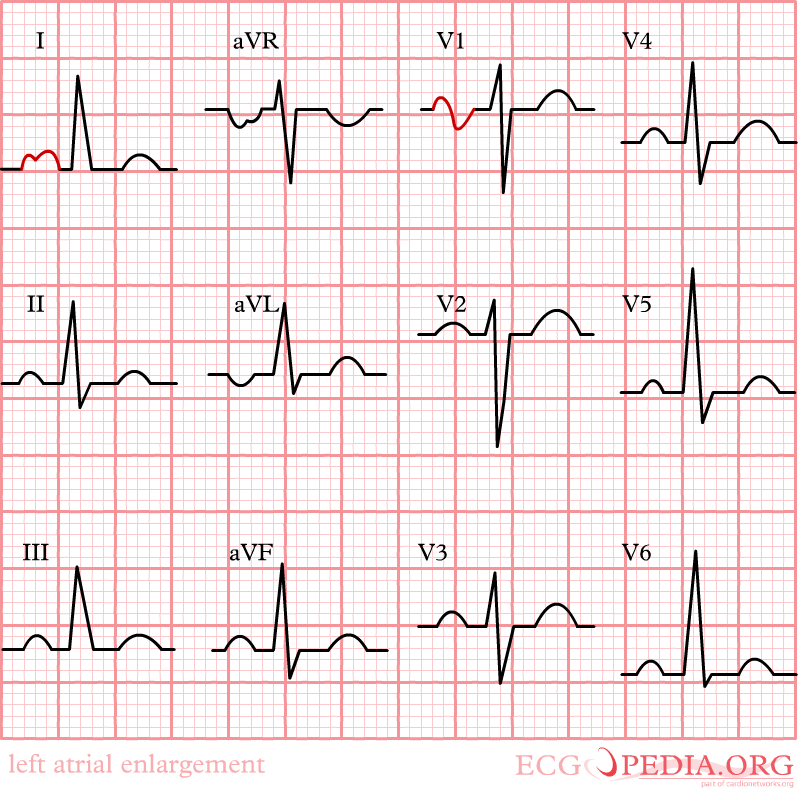
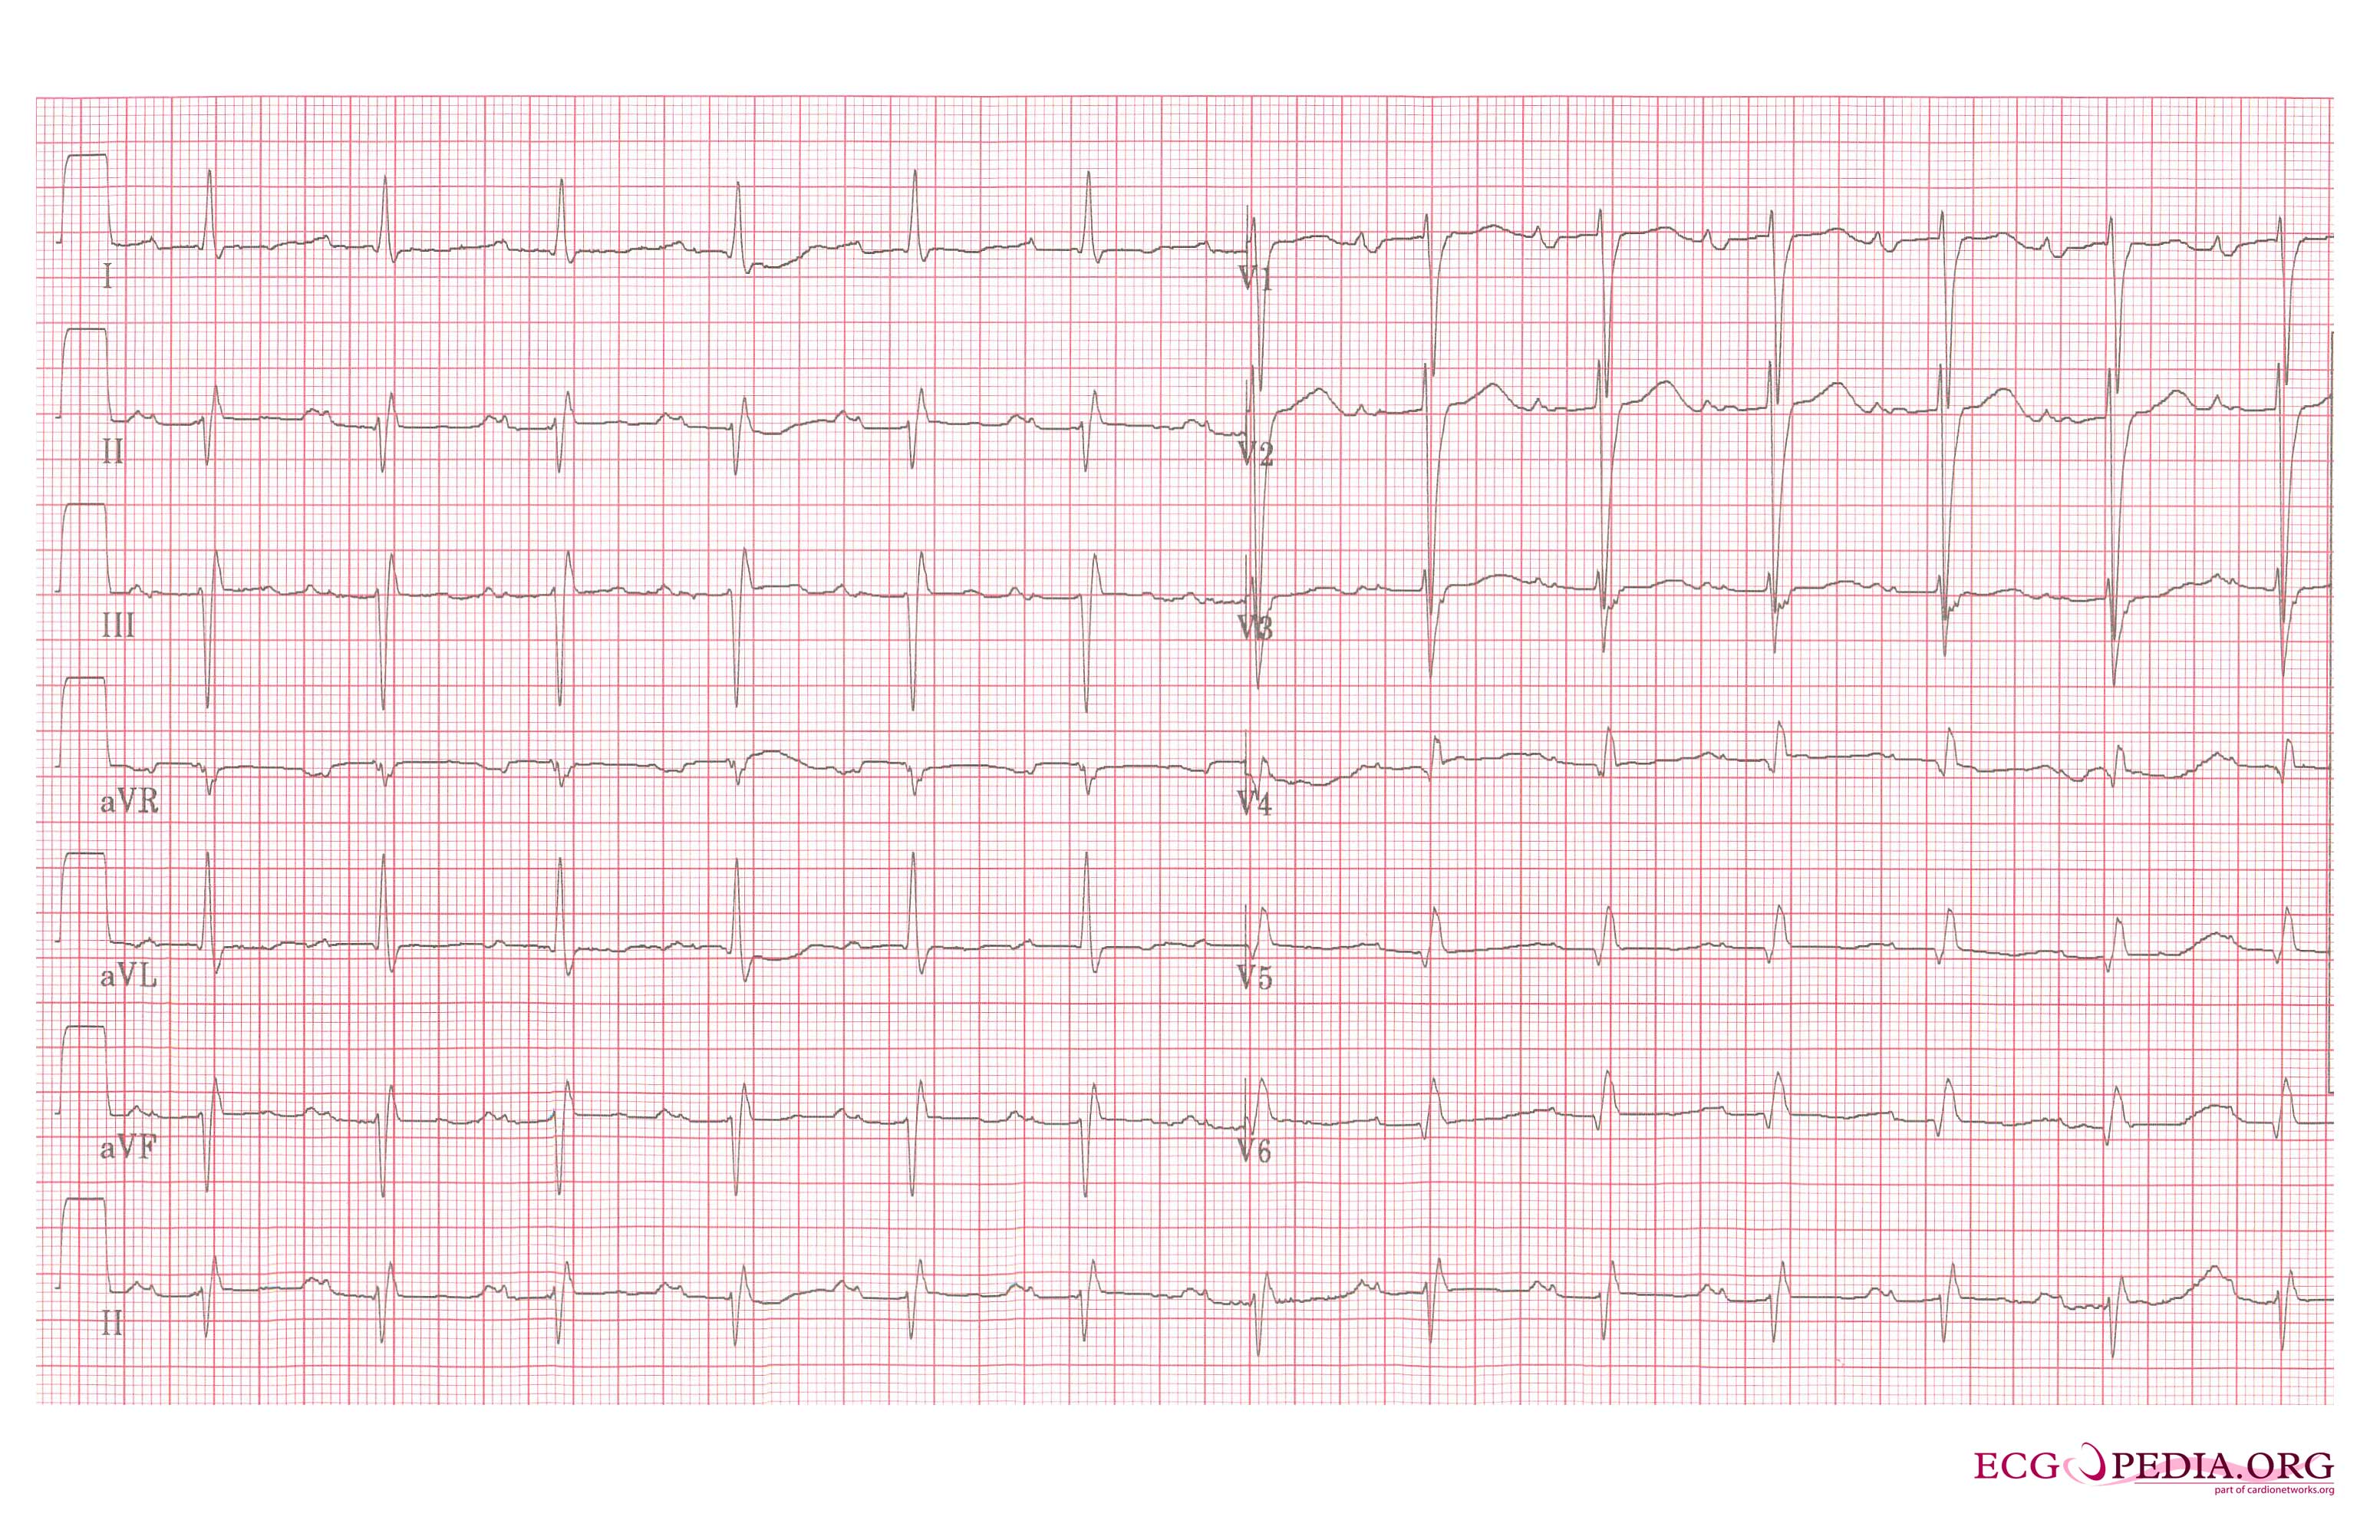
- If the p-wave is enlarged, the atria are enlarged.
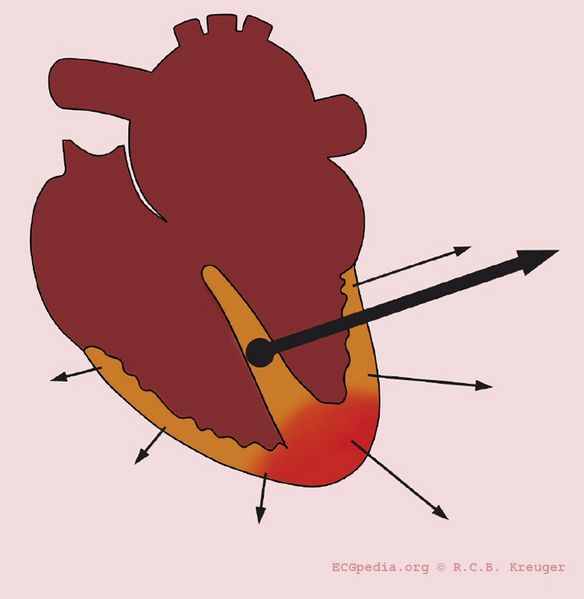
- Characteristics of the P wave in left atrial enlargement:
- P wave with a broad (>0.04 sec or 1 small square) and deeply negative (>1 mm) terminal part in V1 (P mitrale)
- P wave duration >0.12 sec in leads I and / or II
-
Left atrial enlargement
-
Left atrial enlargement with ECG.
-
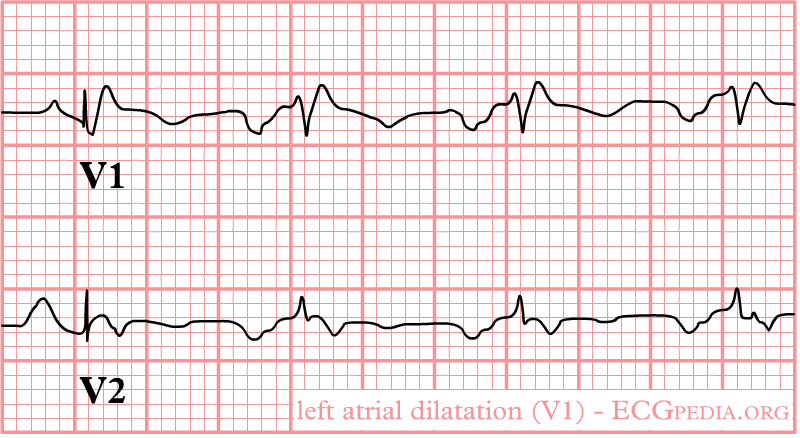
Left atrial enlargement as seen in lead V1.
-
Left atrial enlargement, a 12 lead ECG


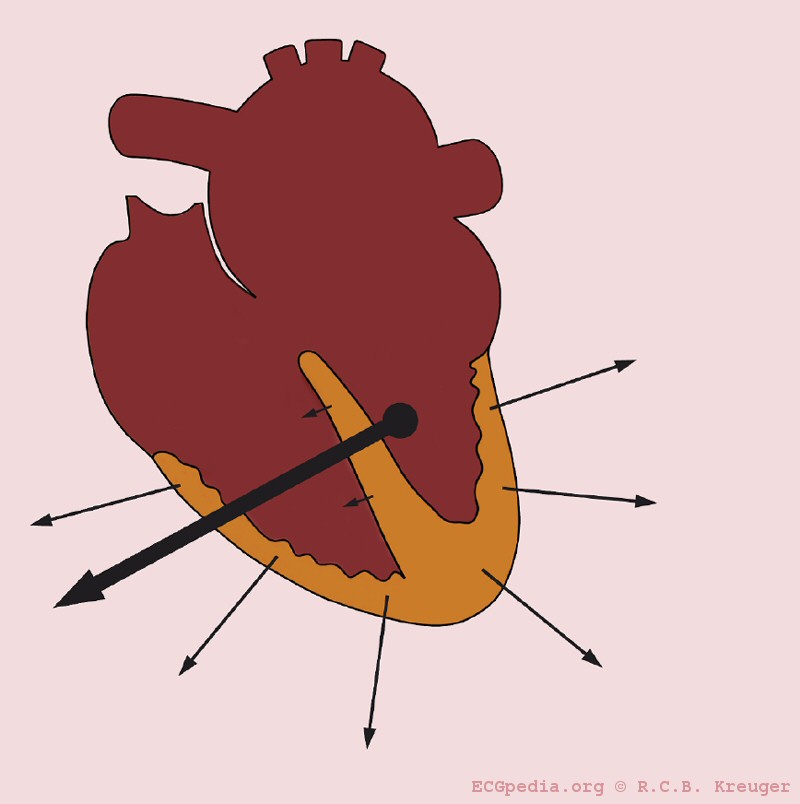
- Characteristics of the P wave in right atrial enlargement:
- P is taller than 2.5 mm in II / III and / or aVF (P pulmonale)
- P >1.5 mm in V1
-
Right atrial enlargement

4. Estimation of the P wave axis
- The P wave normally appears entirely upright on leftward and inferiorly oriented leads such as I, II, aVF, and V4 to V6
- It is negative in aVR because of the rightward orientation of that lead, and it is variable in the other standard leads.
- Differential diagnosis of inverted P waves in I and aVL include dextrocardia and reversed arm lead

- Inverted P Wave in the Inferior Leads, as shown in the picture below, may occur in the setting of a low atrial focus as the origin of the rhythm.

5. Consistency of the P wave shape.
5. The relationship between the P wave and the QRS wave.
6. Morphology of the PTa segment
- Elevation or depression of the PTa segment (the part between the p wave and the beginning of the QRS complex) can result from atrial infarction or pericarditis.

QRS Morphology
The Basic Questions in the Evaluation of QRS Morphology
- Are there any pathological Q waves as a sign of previous myocardial infarction?
- Are there signs of left or right ventricular hypertrophy?
- Does the QRS complex show microvoltage (roughly QRS < 5mm)?
- Is the conduction normal or prolonged (QRS-interval > 0,12s)?
Q wave
- If the first deflection of the QRS is downward it is called Q wave.
- The Q wave represents activation of the ventricular septum as the electricity spreads from the left to the right through the septum.
- Pathologic Q waves are a sign of previous myocardial infarction.
- They are the result of absence of electrical activity because a scar tissue is electrically dead.
- Pathologic Q waves are not an early sign of myocardial infarction, but generally take several hours to days to develop.
- Once pathologic Q waves have developed they rarely go away. However, if the myocardial infarction is reperfused early (e.g. as a result of percutaneous coronary intervention) stunned myocardial tissue can recover and pathologic Q waves disappear. In all other situations they usually persist indefinitely.
- Lead III often shows Q waves, which are not pathologic as long as Q waves are absent in leads II and aVF
- Absence of pathologic Q waves does not exclude a myocardial infarction!
- Definition of a pathologic Q wave:
- Any Q-wave in leads V2–V3 ≥ 0.02 s or QS complex in leads V2 and V3
- Q-wave ≥ 0.03 s and > 0.1 mV deep or QS complex in leads I, II, aVL, aVF, or V4–V6 in any two leads of a contiguous lead grouping (I, aVL,V6; V4–V6; II, III, and aVF)
- R-wave ≥ 0.04 s in V1–V2 and R/S ≥ 1 with a concordant positive T-wave in the absence of a conduction defect
-
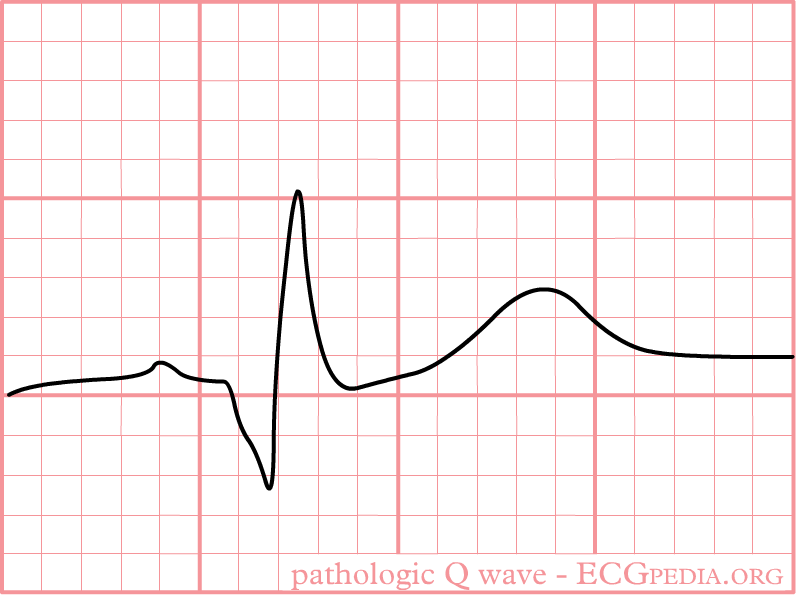
Pathologic Q wave

R wave
- The first upward deflection of the QRS is called the R wave.
- Most of the ventricle is activated during the R wave.
- The septal depolarization corresponds to an initial positive deflection (R wave) in V1 and V2 and negative deflection (Q wave) in V3 and V4.
- Because the left ventricular mass is larger than that of the right ventricle, the vector corresponding to the ventricular mass depolarization is directed towards the left. Thus, the ventricular depolarization corresponds to a negative deflection (S wave) in V1 and V2 and a positive deflection (R wave) in V3 and V4.
- The progression of V1 to V6 is important to notice: The QRS complex is predominantly deflected downwards in V1 and gradually becomes positively deflected to show a predominantly upwards deflection in V6
- The transition zone is where the QRS complex changes from predominately negative to predominately positive (R/S ratio becoming >1), and this usually occurs at V3 or V4. It is normal to have the transition zone at V2 (called "early transition"), and at V5 (called "delayed transition").
- Poor R wave progression (PRWP) is present when the R wave is less than 2–4 mm in leads V3 or V4 and/or when a reversed R wave progression exists, which is defined as R in V4 < R in V3 or R in V3 < R in V2 or R in V2 < R in V1, or any combination of these.
- Causes of poor R wave progression:
- Anterior myocardial infarction
- Left bundle branch block
- Wolff–Parkinson–White syndrome
- Right and left ventricular hypertrophy
- Faulty ECG recording technique.
- The R wave may be prolonged if the ventricle is enlarged.
- The R wave may be abnormally high (indicating strong voltage) if the ventricular muscle tissue is hypertrophied
ST Morphology
- The ST segment is normally at or near the baseline.
ST Elevation
- The most important cause of ST segment elevation is acute ischemia.
- An important clue for the diagnosis of ischemia is the presence of reciprocal ST segment depression.
Causes of ST elevation[1]:
In alphabetical order
- Early repolarization
- Acute pericarditis: ST elevation in all leads except aVR
- Acute sympathic stress: all leads, especially V1-V6
- Acute neurologic events: all leads, primarily V1-V6
- Brugada syndrome
- Cardiac aneurysm
- Cardiac contusion
- Hyperkalemia: V1-V2 (V3)
- Hypertrophic cardiomyopathy: V3-V5 (sometimes V6)
- Hypothermia: ST elevation in V3-V6, II, III and aVF
- Idioventricular rhythm including paced rhythm
- Ischemia
- Left ventricular hypertrophy
- Pulmonary embolism: ST elevation in V1 and aVR
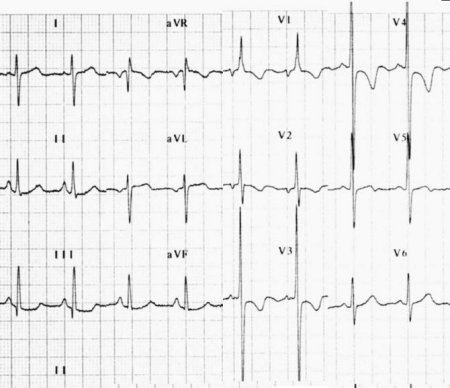
- Below is an ECG showing abnormal ST elevation.

Early Repolarization
- Early repolarization is a term used for ST segment elevation without underlying disease. It probably has nothing to do with actual early repolarization.
- It is commonly seen in young men.
- It is important to discern early repolarization from ST segment elevation from other causes such as ischemia.
- Characteristics of early repolarization are[2]:
- An upward concave elevation of the RS-T segment with distinct or "embryonic" J waves
- Slurred downstroke of R waves or distinct J points or both
- RS-T segment elevation commonly encountered in the precordial leads and more distinct in these leads
- Rapid QRS transition in the precordial leads with counterclockwise rotation
- Persistence of these characteristics for many years
- Absence of reciprocal ST depression
- Large symmetrical T waves
- Below is an image showing ST elevation due to repolarization.

- Below is an ECG showing normal and early repolarization ST elevation.

ST depression
- The most important cause of ST segment depression is Ischemia.
- Reciprocal ST segment depression. If one lead shows ST segment elevation then usually the lead 'on the other side' shows ST segment depression.
Causes of ST segment depression:
In alphabetical order
- Digoxin
- Electrolyte disturbances (low potassium, low magnesium)
- Heart rate-induced changes (post tachycardia)
- Ischemia
- Left ventricular hypertophy with "strain" or depolarization abnormality
- Neurologic events
T wave changes
- The T wave is a non specific indicator of the presence of a cardiac abnormality.
- T waves can be peaked, normal, flat, or inverted (negative).
- Flat T wave: < 0.5 mm negative or positive T wave in leads I, II, V3, V4, V5 or V6
- Negative (or inverted) T wave: > 0.5 mm negative T wave in leads I, II, V3, V4, V5 or V6
- Below is an image showing the different T wave morphologies.

Causes of T wave changes:
In alphabetical order
- Cardiac contusion
- Digoxin
- Ischemia
- Mitral valve prolapse
- Myocardial infarction
- Myocarditis
- Pericarditis
- Subarachnoid hemorrhage
- Ventricular hypertrophy with strain
Sources
ECGpedia.org
References
- ↑ Wang K, Asinger RW, Marriott HJ (2003). "ST-segment elevation in conditions other than acute myocardial infarction". N Engl J Med. 349 (22): 2128–35. doi:10.1056/NEJMra022580. PMID 14645641.
- ↑ Kambara H, Phillips J (1976). "Long-term evaluation of early repolarization syndrome (normal variant RS-T segment elevation)". Am J Cardiol. 38 (2): 157–6. PMID 133604.