Hemolytic anemia laboratory findings
|
Hemolytic anemia Microchapters |
|
Diagnosis |
|---|
|
Treatment |
|
Case Studies |
|
Hemolytic anemia laboratory findings On the Web |
|
American Roentgen Ray Society Images of Hemolytic anemia laboratory findings |
|
Risk calculators and risk factors for Hemolytic anemia laboratory findings |
Editor-In-Chief: C. Michael Gibson, M.S., M.D. [1]
Overview
Hemolytic anemia is anemia caused secondary to shortened survival of circulating red blood cells. The normal life span of RBCs is 110 to 120 days. RBC destruction before that time is defined as hemolytic anemia. As opposed to the normal senecence of RBC, the random hemolysis (premature RBC death) is increased in hemolytic anemia.
Laboratory Findings
Peripheral blood smear
- Fragments of the red blood cells ("schistocytes") can be present.
- Some red blood cells may appear smaller and rounder than usual (spherocytes).
- Reticulocytes are present in elevated numbers. This may be overlooked if a special stain is not used
- The reticulocytes response act as an important indicator for the severity of the hemolytic anemia. The different methods used to judge the correct response are, absolute reticulocyte count, corrected reticulocyte count, and reticulocyte production index.
Reticulocyte count
Absolute reticulocyte count
The normal values are:
- RBC count - 5 million/microLitre
- Reticulocyte count - 0.5 -1.5 %
- Absolute reticulocyte count - 25,000 to 75,000/microLitre
Reticulocyte production index
- Reticulocytes are newly-produced red blood cells. They are slightly larger than totally mature red blood cells, and have some residual ribosomal RNA. The presence of RNA allows a visible blue stain to bind or, in the case of fluorescent dye, result in a different brightness. This allows them to be detected and counted as a distinct population.
- The Reticulocyte production index (RPI, also called a corrected reticulocyte count) is a calculated value used in the diagnosis of anemia.
- The corrected absolute reticulocyte count = absolute reticulocyte count / reticulocyte maturation time (in days).
- This calculation is necessary because the raw reticulocyte count is misleading in anemic patients.
- The problem arises because the reticulocyte count is not really a count but rather a percentage: it reports the number of reticulocytes as a percentage of the number of red blood cells.
- In anemia, the patient's red blood cells are depleted, creating an erroneously elevated reticulocyte count.
- The idea of the RPI is to assess whether the bone marrow is producing an appropriate response to an anemic state.
- Reticulocyte production should increase in response to any loss of red blood cells.
- It should increase within 2-3 days of a major acute hemorrhage, for instance, and reach its peak in 6-10 days.
- If reticulocyte production is not raised in response to anemia, then the anemia may be due to an acute cause with insufficient time to compensate, or there is a defect with red blood cell production in the bone marrow.
- Marrow defects include nutritional deficiencies (i.e. iron, folate, or B12) or insufficient erythropoietin, the stimulus for red blood cell production.
- Reticulocyte Production Index is calculated as follows:
- The degree of anemia (done by normalizing hematocrit of 45%)
- Reticulocyte maturation time (RMT)
- The Reticulocyte maturation time is 1.0 days for a hematocrit of 45 % to 2.5 days for a hematocrit of 15 %:
- Reticulocyte production index = Reticulocytes % x (HCT / 45) x (1 / RMT)
- The reticulocyte index (RI) should be between 1.0 and 2.0 for a healthy individual.
- RI < 2 with anemia indicates decreased production of reticulocytes and therefore red blood cells.
- RI > 2 with anemia indicates loss of red blood cells (destruction, bleeding, etc) leading to increased compensatory production of reticulocytes to replace the lost red blood cells.
- Value of 45 is usually used as a normal hematocrit.
- So,in a person whose reticulocyte count is 5%, hemoglobin 7.5 g/dL, hematocrit 25%, the RPI would be:
5 x [corrected retic count]/[maturation correction] = 5 x (25/45) /2 = 1.4
Other lab tests
- Elevated lactate dehydrogenase (LDH)
- Elevated haptoglobin
- The direct Coombs test is positive if hemolysis is caused by an immune process
Liver function test
Urinalysis
- Hemosiderin in the urine indicates chronic intravascular hemolysis.
- There is also urobilinogen in the urine.
(Images shown below are courtesy of Melih Aktan MD, Istanbul Medical Faculty - Turkey, and Hospital Universitario La Fe Servicio Hematologia)
-
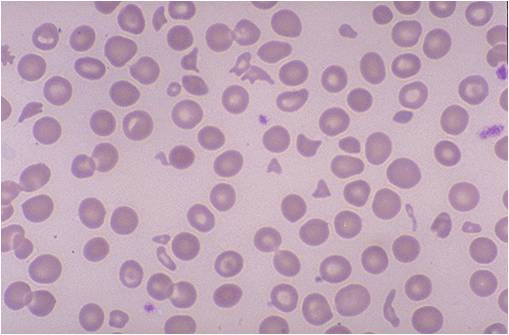
Microangiopathic hemolytic anemia
-
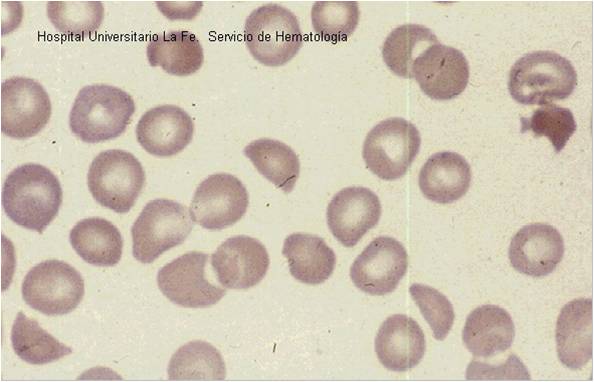
Microangiopathic hemolytic anemia

