T wave

|
WikiDoc Resources for T wave |
|
Articles |
|---|
|
Media |
|
Evidence Based Medicine |
|
Clinical Trials |
|
Ongoing Trials on T wave at Clinical Trials.gov Clinical Trials on T wave at Google
|
|
Guidelines / Policies / Govt |
|
US National Guidelines Clearinghouse on T wave
|
|
Books |
|
News |
|
Commentary |
|
Definitions |
|
Patient Resources / Community |
|
Directions to Hospitals Treating T wave Risk calculators and risk factors for T wave
|
|
Healthcare Provider Resources |
|
Continuing Medical Education (CME) |
|
International |
|
|
|
Business |
|
Experimental / Informatics |
Editor-In-Chief: C. Michael Gibson, M.S., M.D. [1]; Associate Editor-In-Chief: Cafer Zorkun, M.D., Ph.D. [2]
Overview
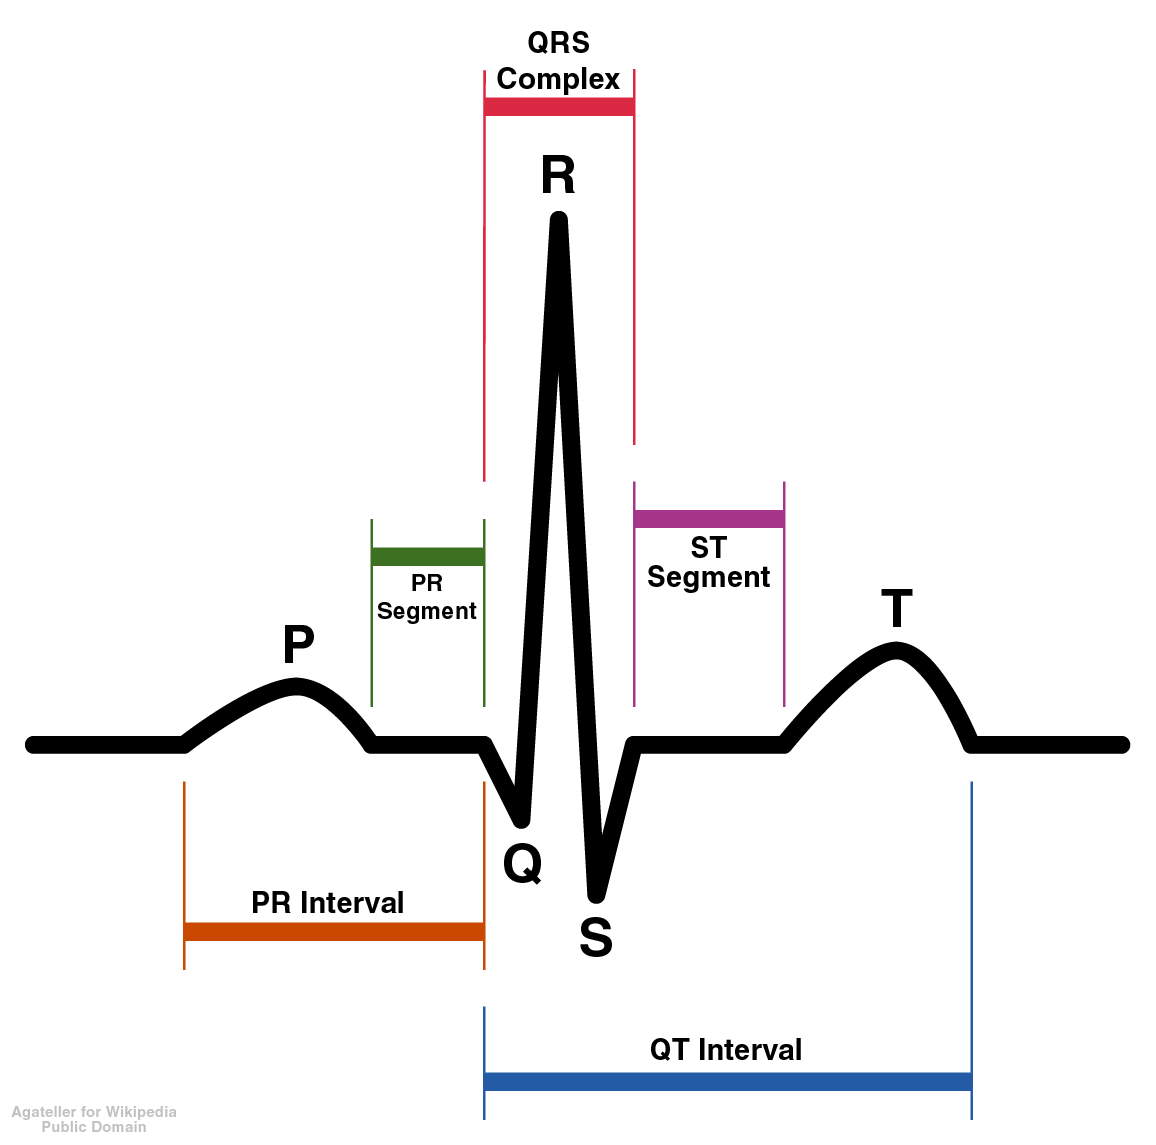
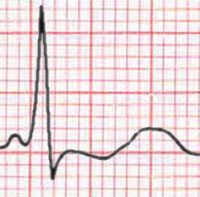
The T wave represents the repolarization (or recovery) of the ventricles. The interval from the beginning of the QRS complex to the apex of the T wave is referred to as the absolute refractory period. The last half of the T wave is referred to as the relative refractory period (or vulnerable period).
Orientation of T waves
Normal Orientation
General
- Normally upright in leads 1 and 2 and in the chest leads over the left ventricle.
Precordial Leads
- Lead V1 may have a positive, negative, or biphasic T wave.
- The T wave in V1 may be inverted at any age (is more often inverted than upright) and the T in V2 can normally be inverted.
- When the T in V1 is upright, it is almost never as tall as the T in V6.
- In infants and young children precordial T waves may be inverted.
- In adult males it is considered abnormal if the T waves are inverted as far to the left as lead V3.
- In adult females the T in V3 may be shallowly inverted.
aVF
- Normally upright in aVL and aVF if the QRS is > 5 mm tall but may be inverted if the R waves are smaller.
- It is not uncommon to have an isolated negative T wave in lead III, aVL, or aVF. Cardiologists are often asked to consult pre-operativley on the patient with the isolated flipped T in lead III.
aVR
- Normally inverted in aVR.
In The Presence of Conduction Delay
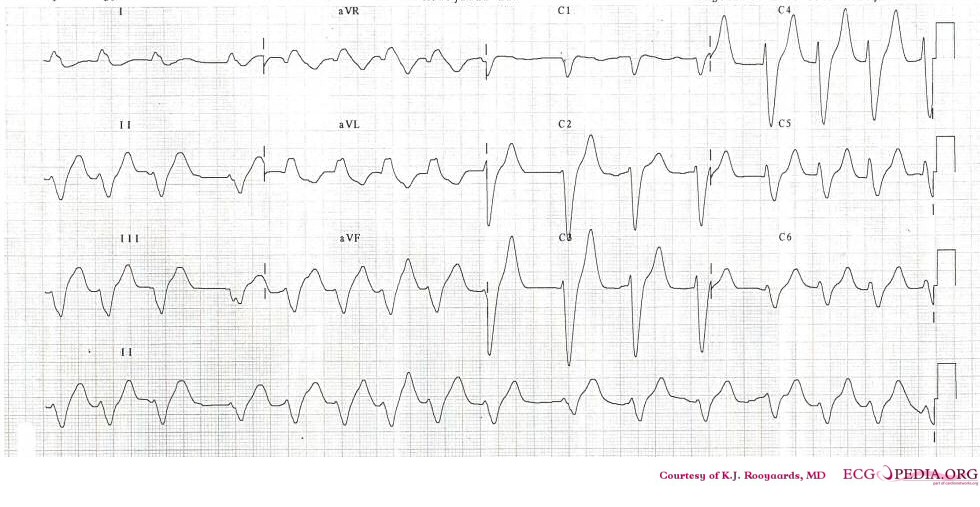
- When a conduction abnormality (e.g., left bundle branch block,right bundle branch block, or a paced rhythm) is present, the T wave should be deflected opposite the terminal deflection of the QRS complex. This is known as appropriate T wave discordance.
Differential Diagnosis of Inverted or Negative T waves:
- Coronary ischemia
- Left ventricular hypertrophy
- CNS disorder.
Morphology of T waves
Shape
Notched
- Notched in children and in adults with Pericarditis
Differential diagnosis of the sharp, tented or pointed T wave
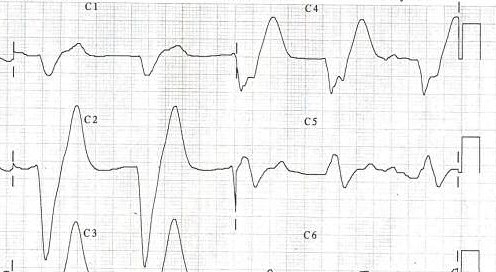
- Tall or "tented" symmetrical T waves may indicate hyperkalemia.
- One of the earliest electrocardiographic finding of acute myocardial infarction is sometimes the hyperacute T wave, which can be distinguished from hyperkalemia by the broad base and slight asymmetry.
- T waves can be sharply pointed in ischemia as well.
Height
The T wave is normally not taller than > 5 mm in any standard lead and not taller than > 10 mm in any precordial lead.
Differential diagnosis of the tall T wave:
- Hyperkalemia
- Left ventricular hypertrophy
- Myocardial Ischemia
- Myocardial infarction
- Ventricular strain
- Psychosis
- Cerebrovascular accident (usually inverted, widely splayed, frequently in subarrachnoid hemorrhages)
Differential diagnosis of the short or flat T wave:
- Coronary ischemia
- Hypokalemia.
- Obesity. This finding may reverse with weight loss
Cerebral T waves
Overview
In 1954 George Burch described T wave abnormalities as myocardial ischemia mimics in patients with a variety of acute cerebral insults. His classic paper [1] published in May 1954 popularized the term Cerebral T waves. The T waves were described as large,were similar to those seen in early myocardial isehemia, and were reported to revert to normal with improvement of the clinical condition,or changed to the pattern of any underlying heart disease present prior to the intracranial insult.
Etiological Theories
Originally the cause was thought to be preexisting coronary artery disease exacerbated by the physiological demands of the critical illness. However in many cases the autopsy studies of the heart showed no abnormality.
Hironosuke et al[2] proposed widespread focal myocytolysis due to overstimulation of sympathetic centres in the hypothalamus leading to release of catecholamines which could damage myocardial cells either by inducing constriction of the myocardial microcirculation, thus leading to focal ischemia, or by a direct toxic effect, as the mechanism which result in the ECG changes seen in Subarachnoid hemorrhage.
Examples
References
- ↑ http://circ.ahajournals.org/content/9/5/719.full.pdf
- ↑ Sakamoto H, Nishimura H, Imataka K, Ieki K, Horie T, Fujii J (1996). "Abnormal Q wave, ST-segment elevation, T-wave inversion, and widespread focal myocytolysis associated with subarachnoid hemorrhage". Japanese Circulation Journal. 60 (4): 254–7. PMID 8726174. Retrieved 2012-05-30. Unknown parameter
|month=ignored (help)
Additional resources
- ECGpedia: Course for interpretation of ECG
- The whole ECG - A basic ECG primer
- 12-lead ECG library
- Simulation tool to demonstrate and study the relation between the electric activity of the heart and the ECG
- ECG information from Children's Hospital Heart Center, Seattle
- ECG Challenge from the ACC D2B Initiative
- National Heart, Lung, and Blood Institute, Diseases and Conditions Index
- A history of electrocardiography
- EKG Interpretations in infants and children


