History of the EKG
Editor-In-Chief: C. Michael Gibson, M.S., M.D. [2]
1843: Emil Du Bois-Reymond, a German physiologist, was the first to describe "action potentials" of muscular contraction. He used a highly sensitive galvanometer, which contained more than 5 km of wire. Du Bios Reymond named the different waves: "o" was the stable equilibrium and he was the first to use the p, q, r and s to describe the different waves. In his paper entitle the 'Naming of the waves in the ECG' Dr Willis Hurst credits Einthoven for being the first to use PQRS and the additional T wave.
1850: M. Hoffa described how he could induce irregular contractions of the ventricles of canine hearts by administering electrical shock.
1872: Alexander Muirhead attached wires to a feverish patient's wrist to obtain a record of the patient's heartbeat while studying for his DSc (in electricity) at St Bartholomew's Hospital[1] This activity was directly recorded and visualized using a Lippmann capillary electrometer by the British physiologist John Burdon Sanderson.[2]
1887: The English physiologist Augustus Waller, working in St Mary's Hospital in Paddington, London.[3] published the first human electrocardiogram. He used a capillary-electrometer fixed to a projector. The trace from the heartbeat was projected onto a photographic plate [3]. This allowed a heartbeat to be recorded in real time.
1893: In 1893 Willem Einthoven (1860-1927) introduced the term 'electrocardiogram'. In 1895 he described how he used a galvanometer to visualize the electrical activity of the heart. The breakthrough came when Willem Einthoven, working in Leiden, The Netherlands, used the string galvanometer invented by him in 1901, which was much more sensitive than the capillary electrometer that Waller had used.[4] He connected electrodes to a patient and showed the electrical difference between two electrodes on the galvanometer. We still now use the term: Eindhoven's leads. The string galvanometer (see Image) was the first clinical instrument on the recording of an ECG.
1905: Einthoven recorded the first 'telecardiogram' from the hospital to his laboratoy 1.5 km away.
1906: Einthoven assigned the letters P, Q, R, S and T to the various deflections, and described the electrocardiographic features of a number of cardiovascular disorders. In 1906, Einthoven published the first article in which he described a series of abnormal ECGs: left- and right bundle branch block, left- and right atrial dilatation, the U wave, notching of the QRS complex, ventricular extrasystoles, ventricular bigemini, atrial flutter and total AV block.
1924: He was awarded the Nobel Prize in Medicine for his discovery.[5]
-
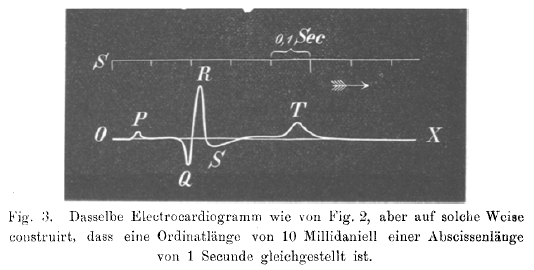
ECG from Einthoven's first publication. Pfügers Archiv March 1895, page 101-123
-
William Einthoven (1860-1927), the founder of the current ECG
-
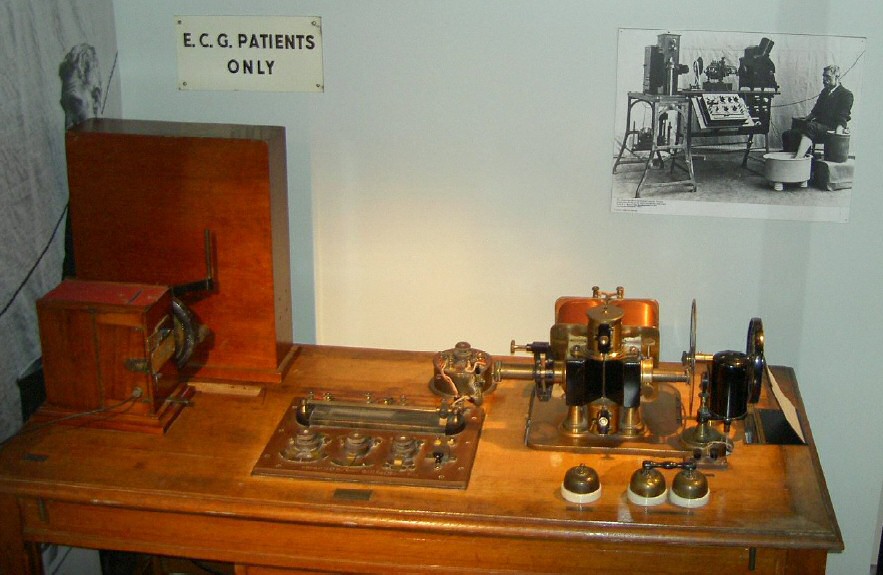
Einthoven's string-galvanometer, now in the Science Museum in London. The patient had to put his hands in salt baths to which the electrodes were connected. Image from the IEEE history society.


Modern History: Though the basic principles of that era are still in use today, there have been many advances in electrocardiography over the years. The instrumentation, for example, has evolved from a cumbersome laboratory apparatus to compact electronic systems that often include computerized interpretation of the electrocardiogram.
-
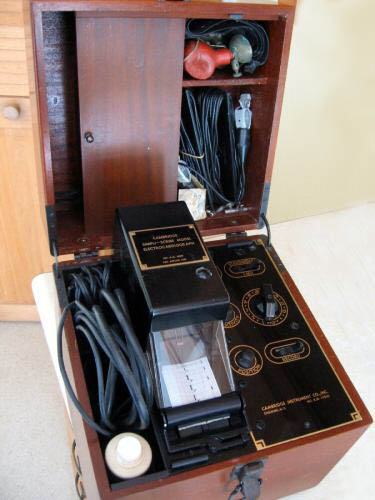
The Cambridge Simpliscribe, a popular ECG instrument of the 1950s and 1960s. Vacuum tube technology.
-
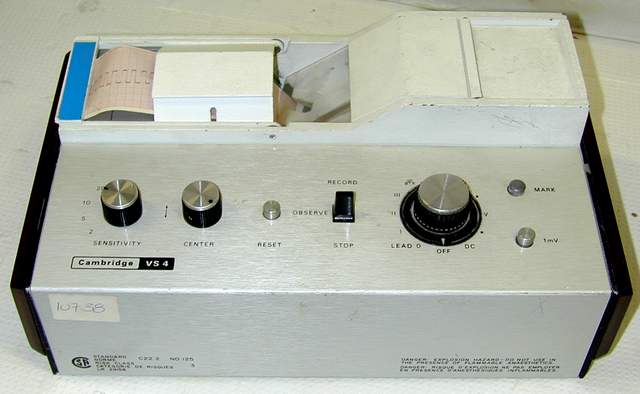
The Cambridge VS4, a popular ECG instrument of the 1970s and 1980s. Solid state technology.
-
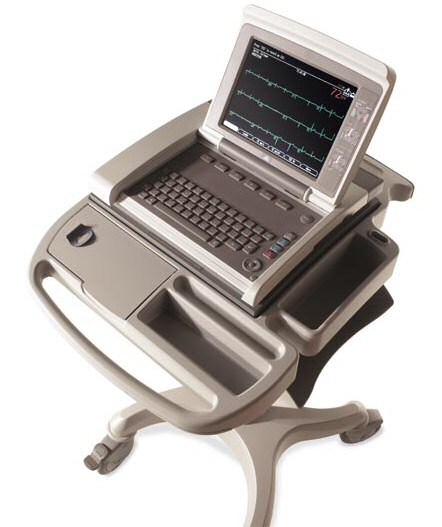
The last generation of ECG equipment. Image courtesy of General Electric


Present Day: In contrast to the 12 leads of data and the limited anterior or front view of the heart from a traditional EKG, an 80 lead EKG utilizes 80 leads placed on both the front and back of the patient to analyze a 360-degree spatial view of the heart. This new technology may allow the more rapid and accurate detection of STEMI and thereby potentially speed the delivery of care.
-
A nurse places an 80 lead EKG on a patient
-
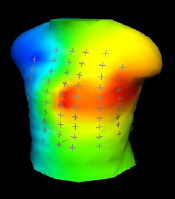
Shown here is the color representation of the 80 lead EKG.
-
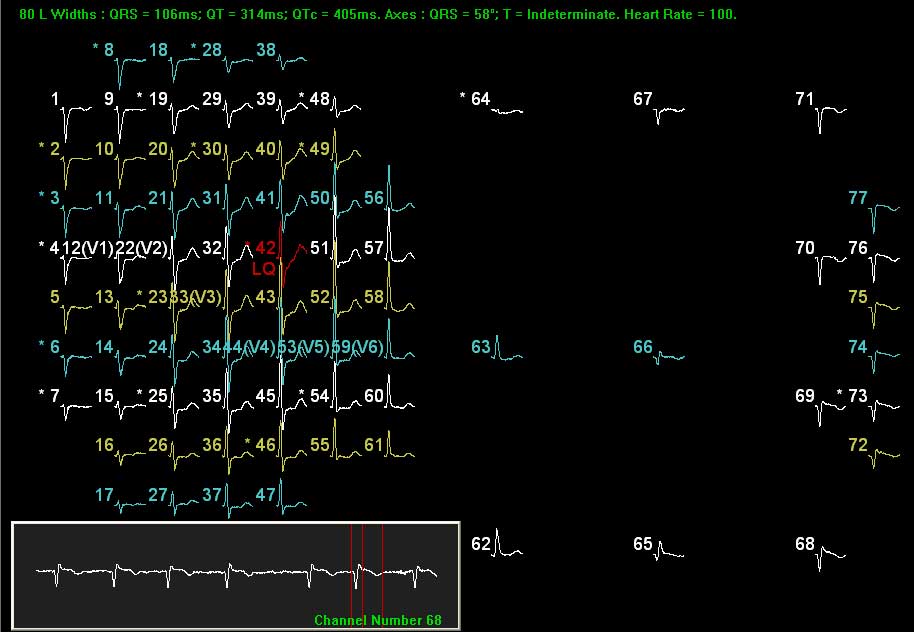
80 lead EKG.


References
- ↑ Ronald M. Birse, rev. Patricia E. Knowlden [1] Oxford Dictionary of National Biography 2004 (Subscription required)
- ↑ Burdon Sanderson J (1878). "Experimental results relating to the rhythmical and excitatory motions of the ventricle of the frog heart". Proc Roy Soc Lond. 27: 410&ndash, 14.
- ↑ Waller AD (1887). "A demonstration on man of electromotive changes accompanying the heart's beat". J Physiol (Lond). 8: 229&ndash, 34.
- ↑ Einthoven W. Un nouveau galvanometre. Arch Neerl Sc Ex Nat 1901; 6:625
- ↑ Cooper J (1986). "Electrocardiography 100 years ago. Origins, pioneers, and contributors". N Engl J Med. 315 (7): 461–4. PMID 3526152.
External links
- ECGpedia: Course for interpretation of ECG
- The whole ECG - A basic ECG primer
- 12-lead ECG library
- Simulation tool to demonstrate and study the relation between the electric activity of the heart and the ECG
- ECG information from Children's Hospital Heart Center, Seattle
- ECG Challenge from the ACC D2B Initiative
- National Heart, Lung, and Blood Institute, Diseases and Conditions Index
- A history of electrocardiography
- EKG Interpretations in infants and children
- Naming of the Waves in the ECG, With a Brief Account of Their Genesis