Editor-In-Chief: C. Michael Gibson, M.S., M.D. [1]; Associate Editor-In-Chief: Cafer Zorkun, M.D., Ph.D. [2], Sujit Routray, M.D. [3]
Overview
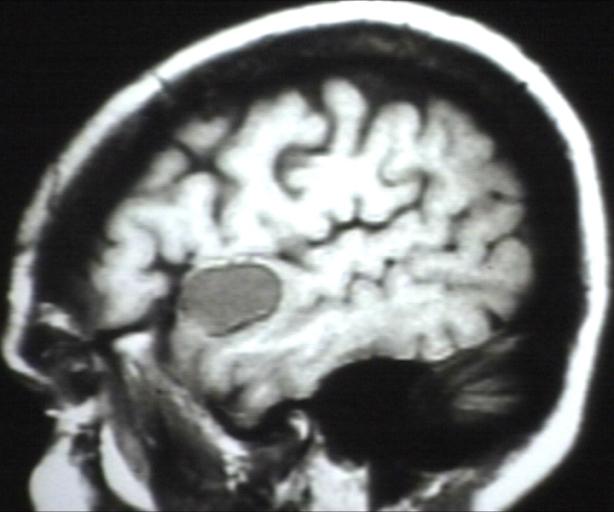
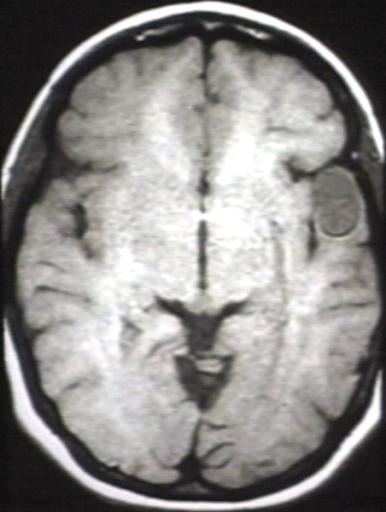
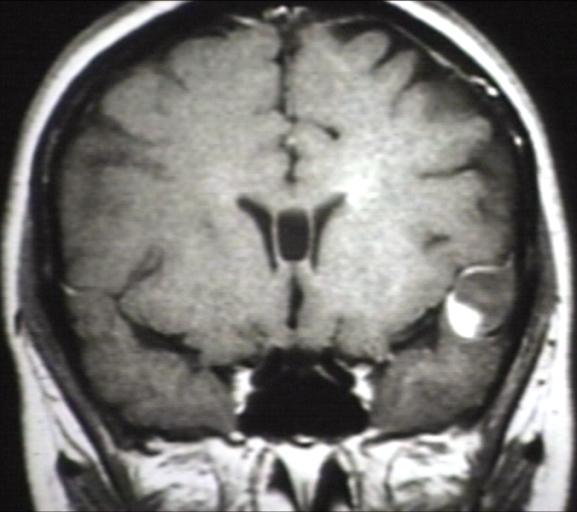
Brain MRI may be diagnostic of glioma. The MRI findings of glioma vary with the tumor grade and type.[1][2][3][4][5][6]
MRI
- Brain MRI may be diagnostic of glioma.
- The MRI findings of glioma vary with the tumor grade and type. Common findings are listed below:[1][2][3][4][5][6]
|
|
| Type of glioma
|
MRI findings
|
|---|
|
Pilocytic astrocytoma
|
- 1. T1: Iso- to hypointense solid component
- 2. T2: Hyperintense solid component
|
|
Low-grade astrocytoma
|
- 1. T1:
- Isointense to hypointense
- Confined to the white matter and causes expansion of the adjacent cortex
- 2. T2/FLAIR:
- Mass-like hyperintense signals
- Confined to the white matter and causes expansion of the adjacent cortex
- Cortex can also be involved in late cases in comparison to the oligodendroglioma, which is a cortical based tumor from the start
- Microcystic changes along the line of spread
- High T2 signal (not related to cellularity or cellular atypia, but rather edema, demyelination, and other degenerative changes)
- 3. DWI:
- No restricted diffusion
- Increased diffusibility
- 4. T1 C+ (Gd): No enhancement
- 5. MR spectroscopy:
- 6. MR perfusion: No elevation of rCBV
|
|
Anaplastic astrocytoma
|
- 1. T1: Hypointense
- 2. T2: Hyperintense but can be heterogeneous, if calcification of blood present
- 3. T1 C+ (Gd):
- Variable enhancement
- Presence of ring enhancement suggests central necrosis
- 4. MR spectroscopy:
- Increased choline/creatine ratio
- NAA preserved or mildly depressed
- No significant lactate
- Intermediate levels of myo-inositol (lower than low grade, higher than glioblastoma)
- 5. MR perfusion: Elevated cerebral blood volume
|
|
Glioblastoma multiforme
|
- 1. T1:
- Hypo- to isointense mass within white matter
- Central heterogenous signal (necrosis, intratumoral hemorrhage)
- 2. T1 C+ (Gd):
- Variable enhancement
- Typically peripheral and irregular with nodular components
- Completely surrounds necrosis
- 3. T2/FLAIR:
- Hyperintense
- Surrounded by vasogenic edema
- Flow voids
- 4. GE/SWI:
- Susceptibility artifact on T2 from blood products or calcification
- Low intensity rim from blood product
- Located inside the peripheral enhancing component
- Absent dual rim sign
- 5. DWI/ADC:
- Solid component
- Elevated signal on DWI is common in solid / enhancing component
- Diffusion restriction is typically intermediate similar to normal white matter, but significantly elevated compared to surrounding vasogenic edema
- ADC values correlate with grade:
- WHO IV (GBM) = 745 ± 135 x 10-6 mm2/s
- WHO III (anaplastic) = 1067 ± 276 x 10-6 mm2/s
- WHO II (low grade) = 1273 ± 293 x 10-6 mm2/s
- ADC threshold value of 1185 x 10-6 mm2/s sensitivity (97.6%) and specificity (53.1%) in the discrimination of high-grade (WHO grade III & IV) and low-grade (WHO grade II) gliomas
- 6. Non-enhancing necrotic / cystic component: Vast majority (>90%) have facilitated diffusion (ADC values > 1000 x 10-6 mm2/s)
- 7. MR perfusion: rCBV elevated compared to lower grade tumors and normal brain
- 8. MR spectroscopy:
|
|
Oligodendroglioma
|
- 1. T1: Hypointense
- 2. T2: Hyperintense
- 3. SWI: Calcium seen as areas of "blooming"
- 4. T1 C+ (Gd): Contrast enhancement is common
- 5. DWI: No diffusion restriction
- 6. MR perfusion: increased vascularity "chicken wire" network of vascularity results in elevated relative cerebral blood volume (rCBV)
|
|
Ependymoma
|
- 1. T1: Iso- to hypointense solid component
- 2. T2: Hyperintense to white matter
- 3. SWI: Foci of blooming from hemorrhage or calcification
- 4. T1 C+ (Gd): Heterogenous enhancement
- 5. DWI/ADC: Restricted diffusion in solid components
- 6. MR spectroscopy:
|
Images shown below are courtesy of Professor Peter Anderson DVM PhD and published with permission © PEIR, University of Alabama at Birmingham, Department of Pathology
-
-
-
-
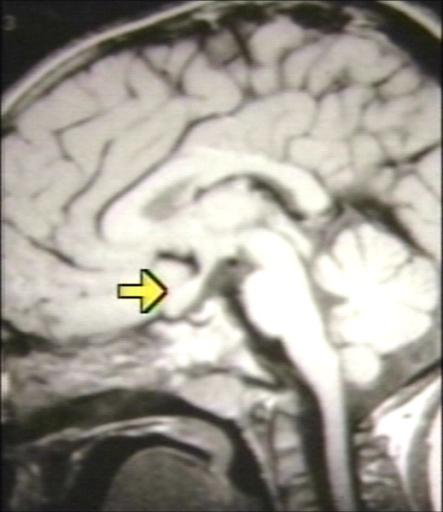
MRI of optic nerve glioma
References
Template:WikiDoc Sources