Atrial flutter electrocardiogram
|
Atrial flutter Microchapters |
|
Diagnosis |
|---|
|
Treatment |
|
Case Studies |
|
Atrial flutter electrocardiogram On the Web |
|
American Roentgen Ray Society Images of Atrial flutter electrocardiogram |
|
Risk calculators and risk factors for Atrial flutter electrocardiogram |
Editor-In-Chief: C. Michael Gibson, M.S., M.D. [1]; Associate Editor(s)-in-Chief: Cafer Zorkun, M.D., Ph.D. [2] Farima Kahe M.D. [3]
Overview
Characteristic electrocardiographic findings in a patient with atrial flutter include; an atrial rate from 250-350 beats per minute, a "sawtooth" appearance to the tracings due to rapid regular undulations (F waves), and a variable ventricular rate depending on AV conduction.
Electrocardiogram
Findings on an ECG suggestive of atrial flutter include:[1]
- There are rapid regular undulations (F waves) that cause a sawtooth appearance.
- Atrial rate is 250 to 350 Beats Per Minute (BPM).
- There is a variable ventricular rate depending on the AV conduction.
- The most common response is 2:1.
- 3:1 is uncommon.
- 4:1 suggests the existence of an AV conduction defect
- May be associated with complete AV block in which case the RR intervals are regular and the F waves have no constant relationship to the QRS. The ventricular response is usually slow.
- 1:1 conduction may be precipitated by excitement, exercise, induction of anesthesia or any increase in sympathetic tone.
- It may occur in WPW where the impulses are conducted antegrade through the bypass tract. All these are an emergency.
- During treatment with quinidine the atrial rate may slow sufficiently to permit 1:1 conduction.
- Vagal maneuvers increase the degree of AV block.
- QRS complex either normal or aberrant depending on preexisting IVCD or aberrant ventricular conduction.
EKG Examples
Shown below is an EKG with an alternating 2:1 and 3:1 atrial flutter.
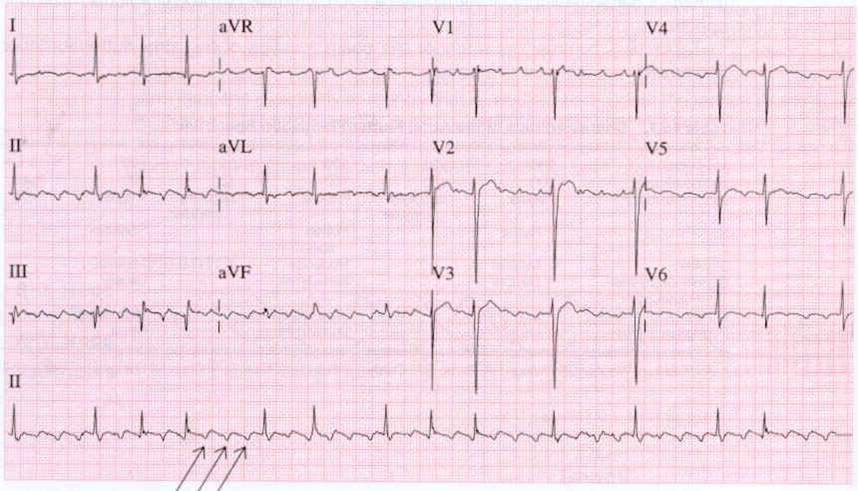
Copyleft image obtained courtesy of ECGpedia, http://en.ecgpedia.org/wiki/File:Aflutr_ecg.jpg
Shown below is an EKG depicting atrial flutter.
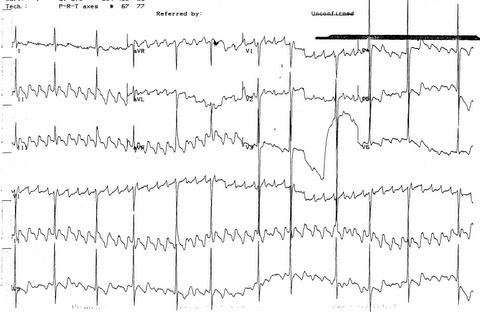
Copyleft image obtained courtesy of ECGpedia, http://en.ecgpedia.org/wiki/Main_Page
Shown below is an EKG of a 2:1 atrial flutter.
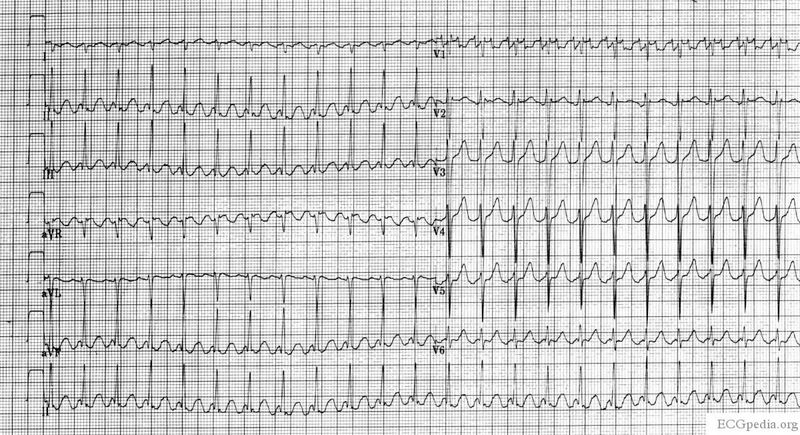
Copyleft image obtained courtesy of ECGpedia, http://en.ecgpedia.org/wiki/File:ECG_Aflutt.jpg
Shown below is an EKG of a 2:1 atrial flutter.
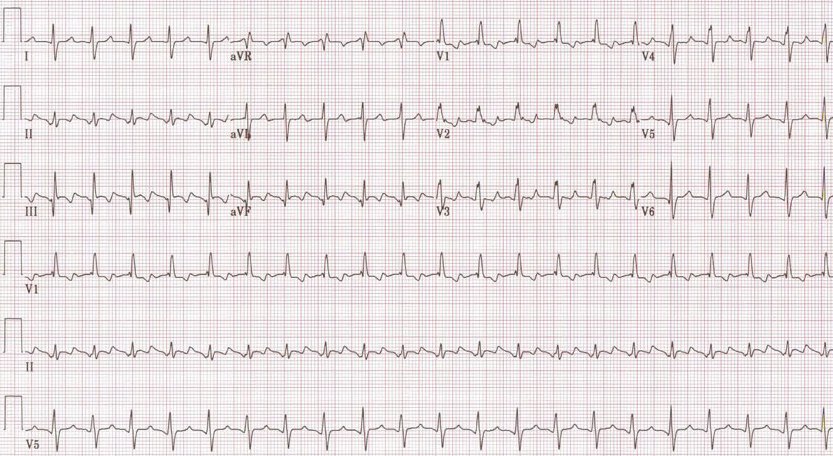
Copyleft image obtained courtesy of ECGpedia, http://en.ecgpedia.org/wiki/Main_Page
Shown below is an EKG depicting a 3:1 atrial flutter.
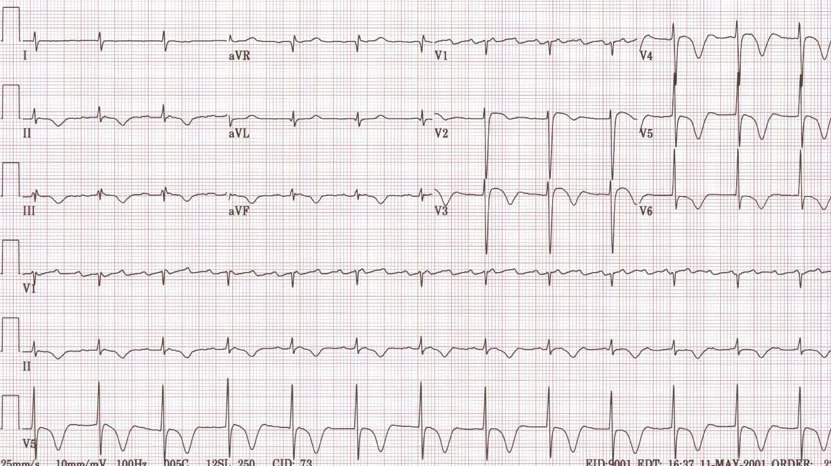
Copyleft image obtained courtesy of ECGpedia, http://en.ecgpedia.org/wiki/Main_Page
Shown below is an EKG depicting a 4:1 atrial flutter.
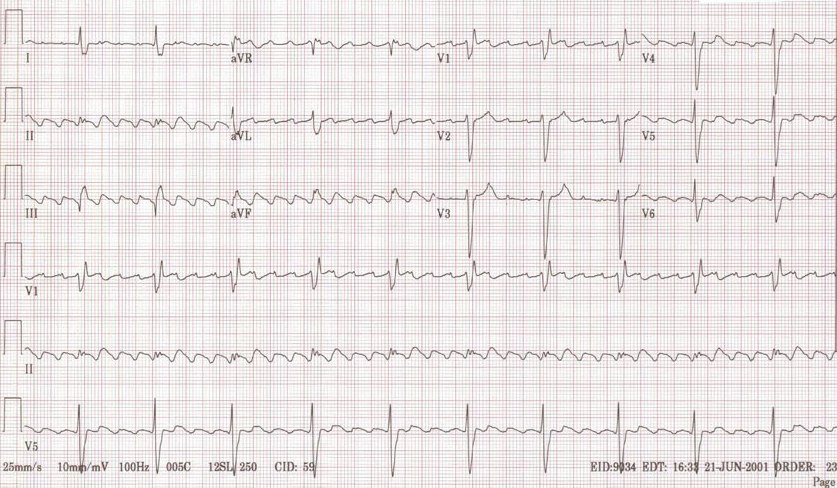
Copyleft image obtained courtesy of ECGpedia, http://en.ecgpedia.org/wiki/Main_Page
Shown below is an EKG depicting an atrial flutter with right bundle branch block demonstrated by Rsr' pattern in leads V1, V2, and V3.
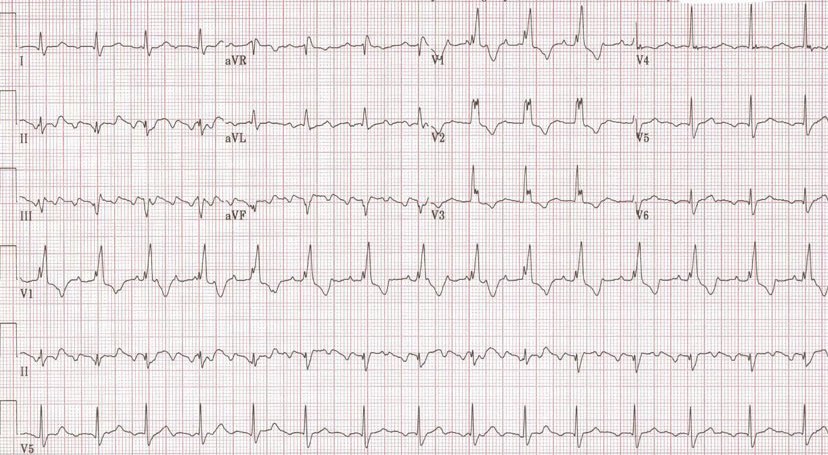
Copyleft image obtained courtesy of ECGpedia, http://en.ecgpedia.org/wiki/Main_Page
Shown below is an EKG from an 82 year old man with a history of lung disease and renal failure. At the time of this recording the patient was on iron, lasix, and bronchodilators. The EKG shows a regular rhythm at a rate of 141/min. This patient had been in atrial fibrillation in the past and the rhythm here is probably atrial flutter with 2:1 block although no flutter waves are seen. The QRS duration is widened at 105 ms and the tall R waves in V5 and S waves in V1 and V2 and the ST depression in the absence of digoxin suggest left ventricular hypertrophy. The QRS is too narrow for ventricular tachycardia and the brief R wave in V2 with the clean down-stroke of the V2 S wave argue against a ventricular origin. The patient was placed on digoxin with a slowing of the ventricular rate and a rhythm that was clearly atrial fibrillation and with a QRS with the same morphology.
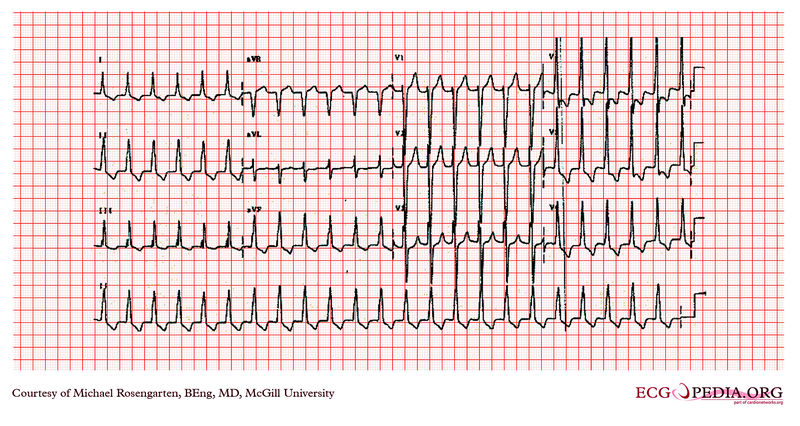
Copyleft image obtained courtesy of ECGpedia, http://en.ecgpedia.org/wiki/File:E338.jpg
Shown below is an EKG depicting an atrial flutter with variable conduction.
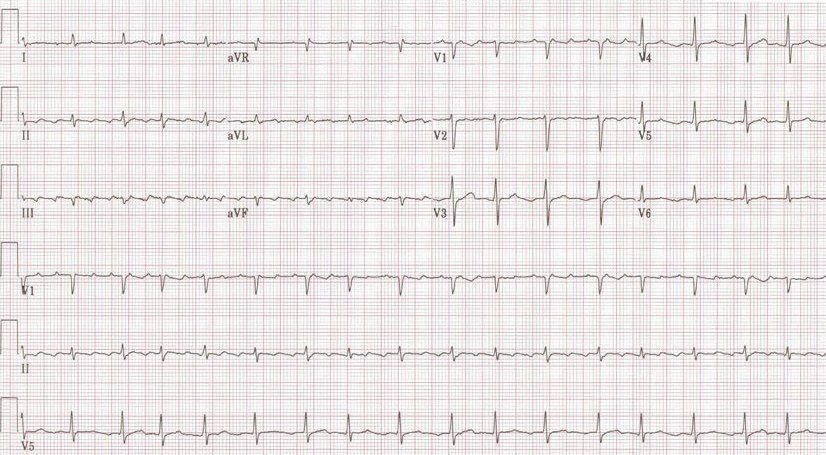
Copyleft image obtained courtesy of ECGpedia, http://en.ecgpedia.org/wiki/Main_Page
Shown below is an EKG of a patient being treated with an external cardioverter/defibrillator for atrial flutter. The patient is under general anesthesia and two shocks were given, the first at 50 joules and the second at 100 joules.

Copyleft image obtained courtesy of ECGpedia, http://en.ecgpedia.org/wiki/File:E00031671.jpg
Shown below is an EKG of a spontaneous termination of atrial flutter. The flutter waves can be seen deforming the QRS especially in leads II and III.
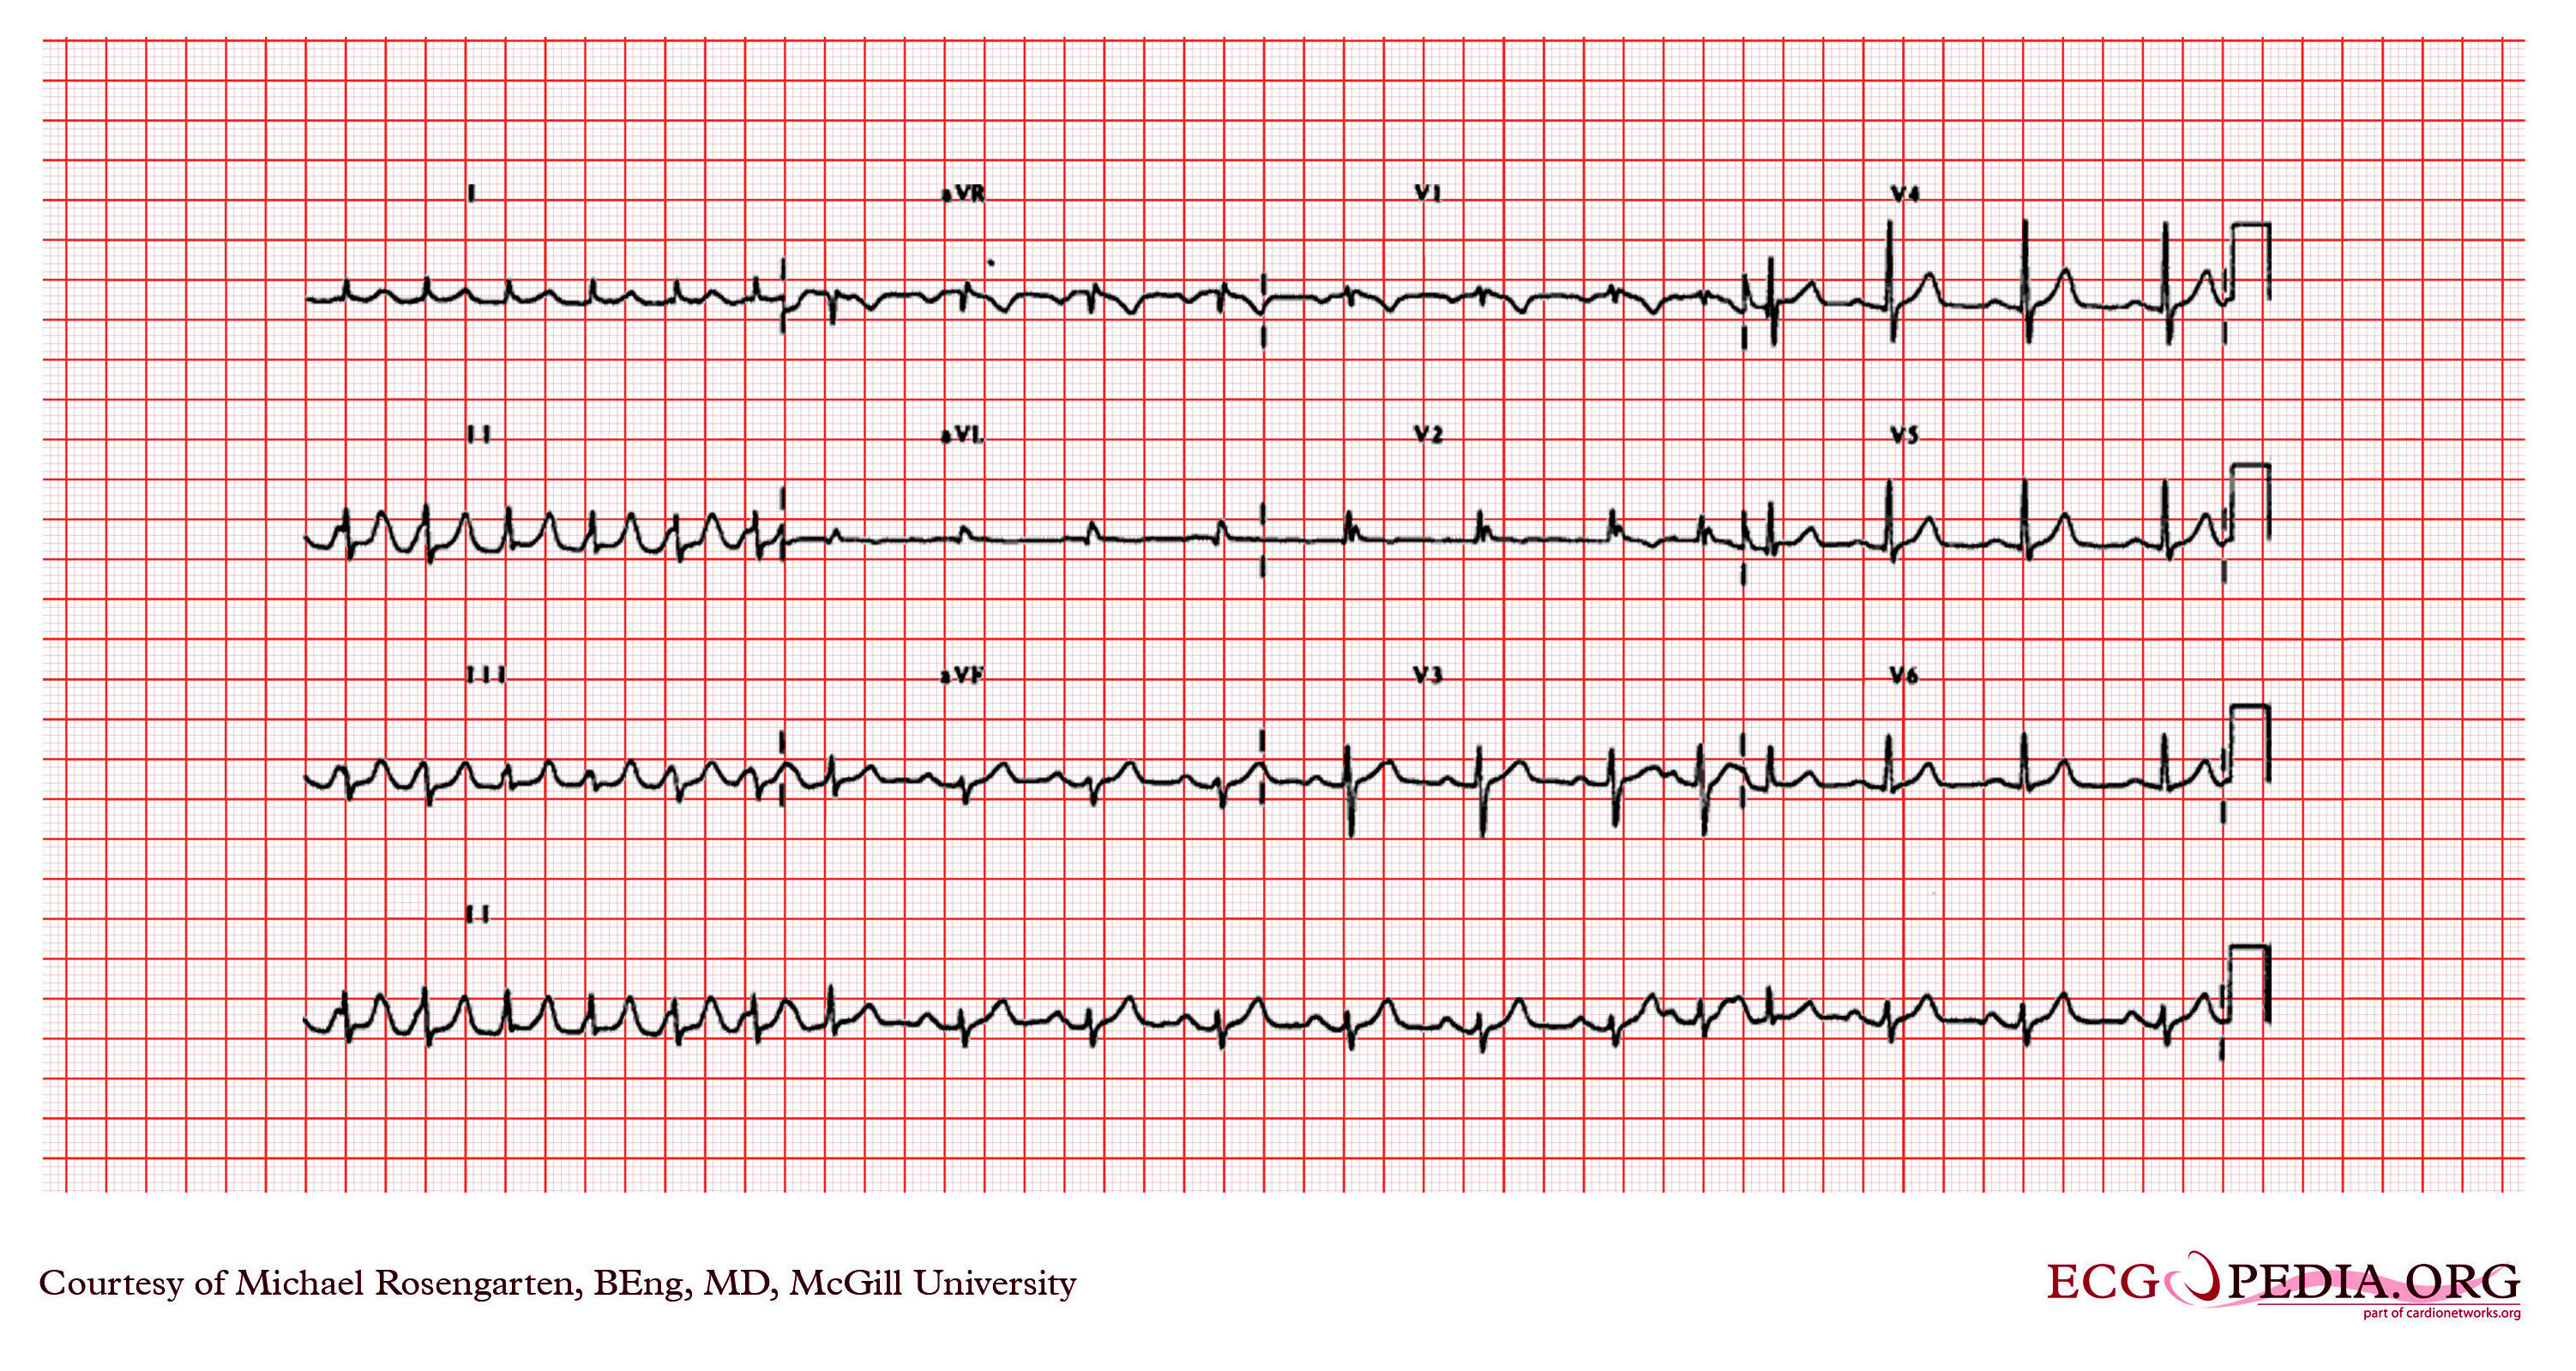
Copyleft image obtained courtesy of ECGpedia, http://en.ecgpedia.org/wiki/File:E207.jpg
Shown below is an EKG depicting a spontaneous termination of atrial flutter. The termination occurs just at the first lead switch (e.g. lead I to aVR). Note that the QRS does not change but is deformed by the large flutter waves that are running at a rate of about 300/min. There is low QRS voltages (minus the flutter waves) in the precordial leads (< 5 mm).
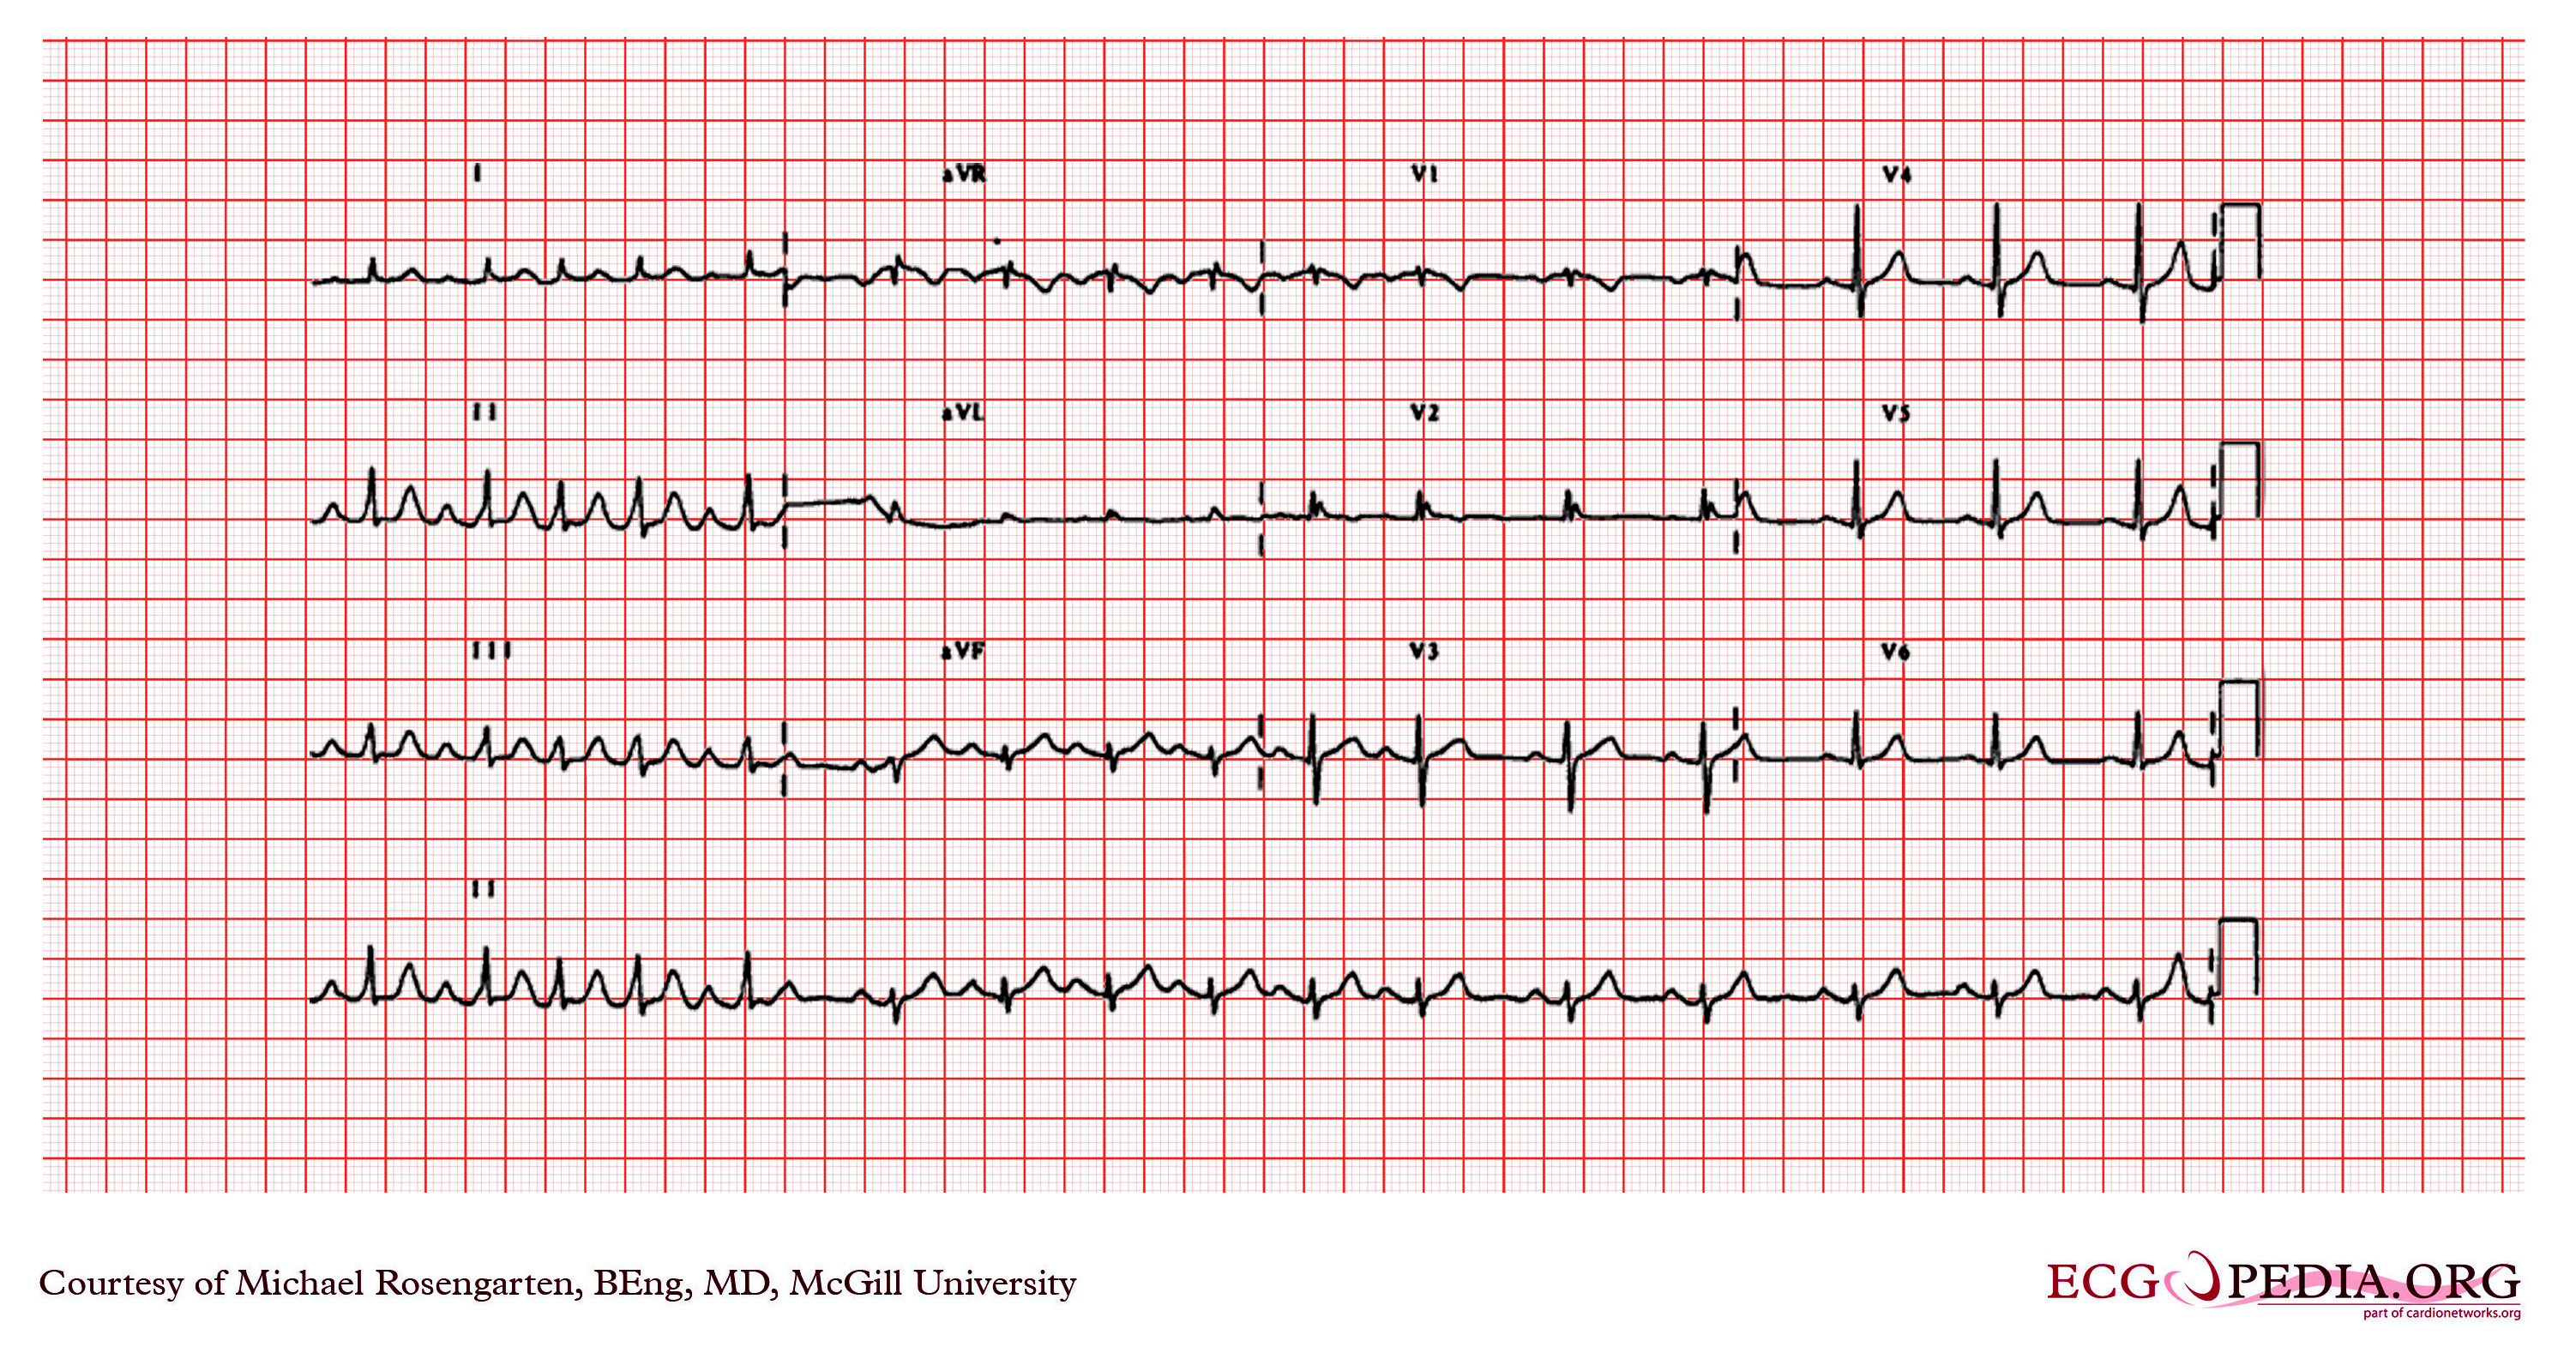
Copyleft image obtained courtesy of ECGpedia, http://en.ecgpedia.org/wiki/File:E192.jpg
Shown below is an EKG of an atrial flutter with flutter waves seen best in the inferior leads and in leads V1 to V3. The atrial rate is about 250/min. The QRS is wide (>120ms) and there is a tall R' wave in V1 and a shallow S in V6. The axis of the QRS seems normal. The EKG shows a right bundle branch block.
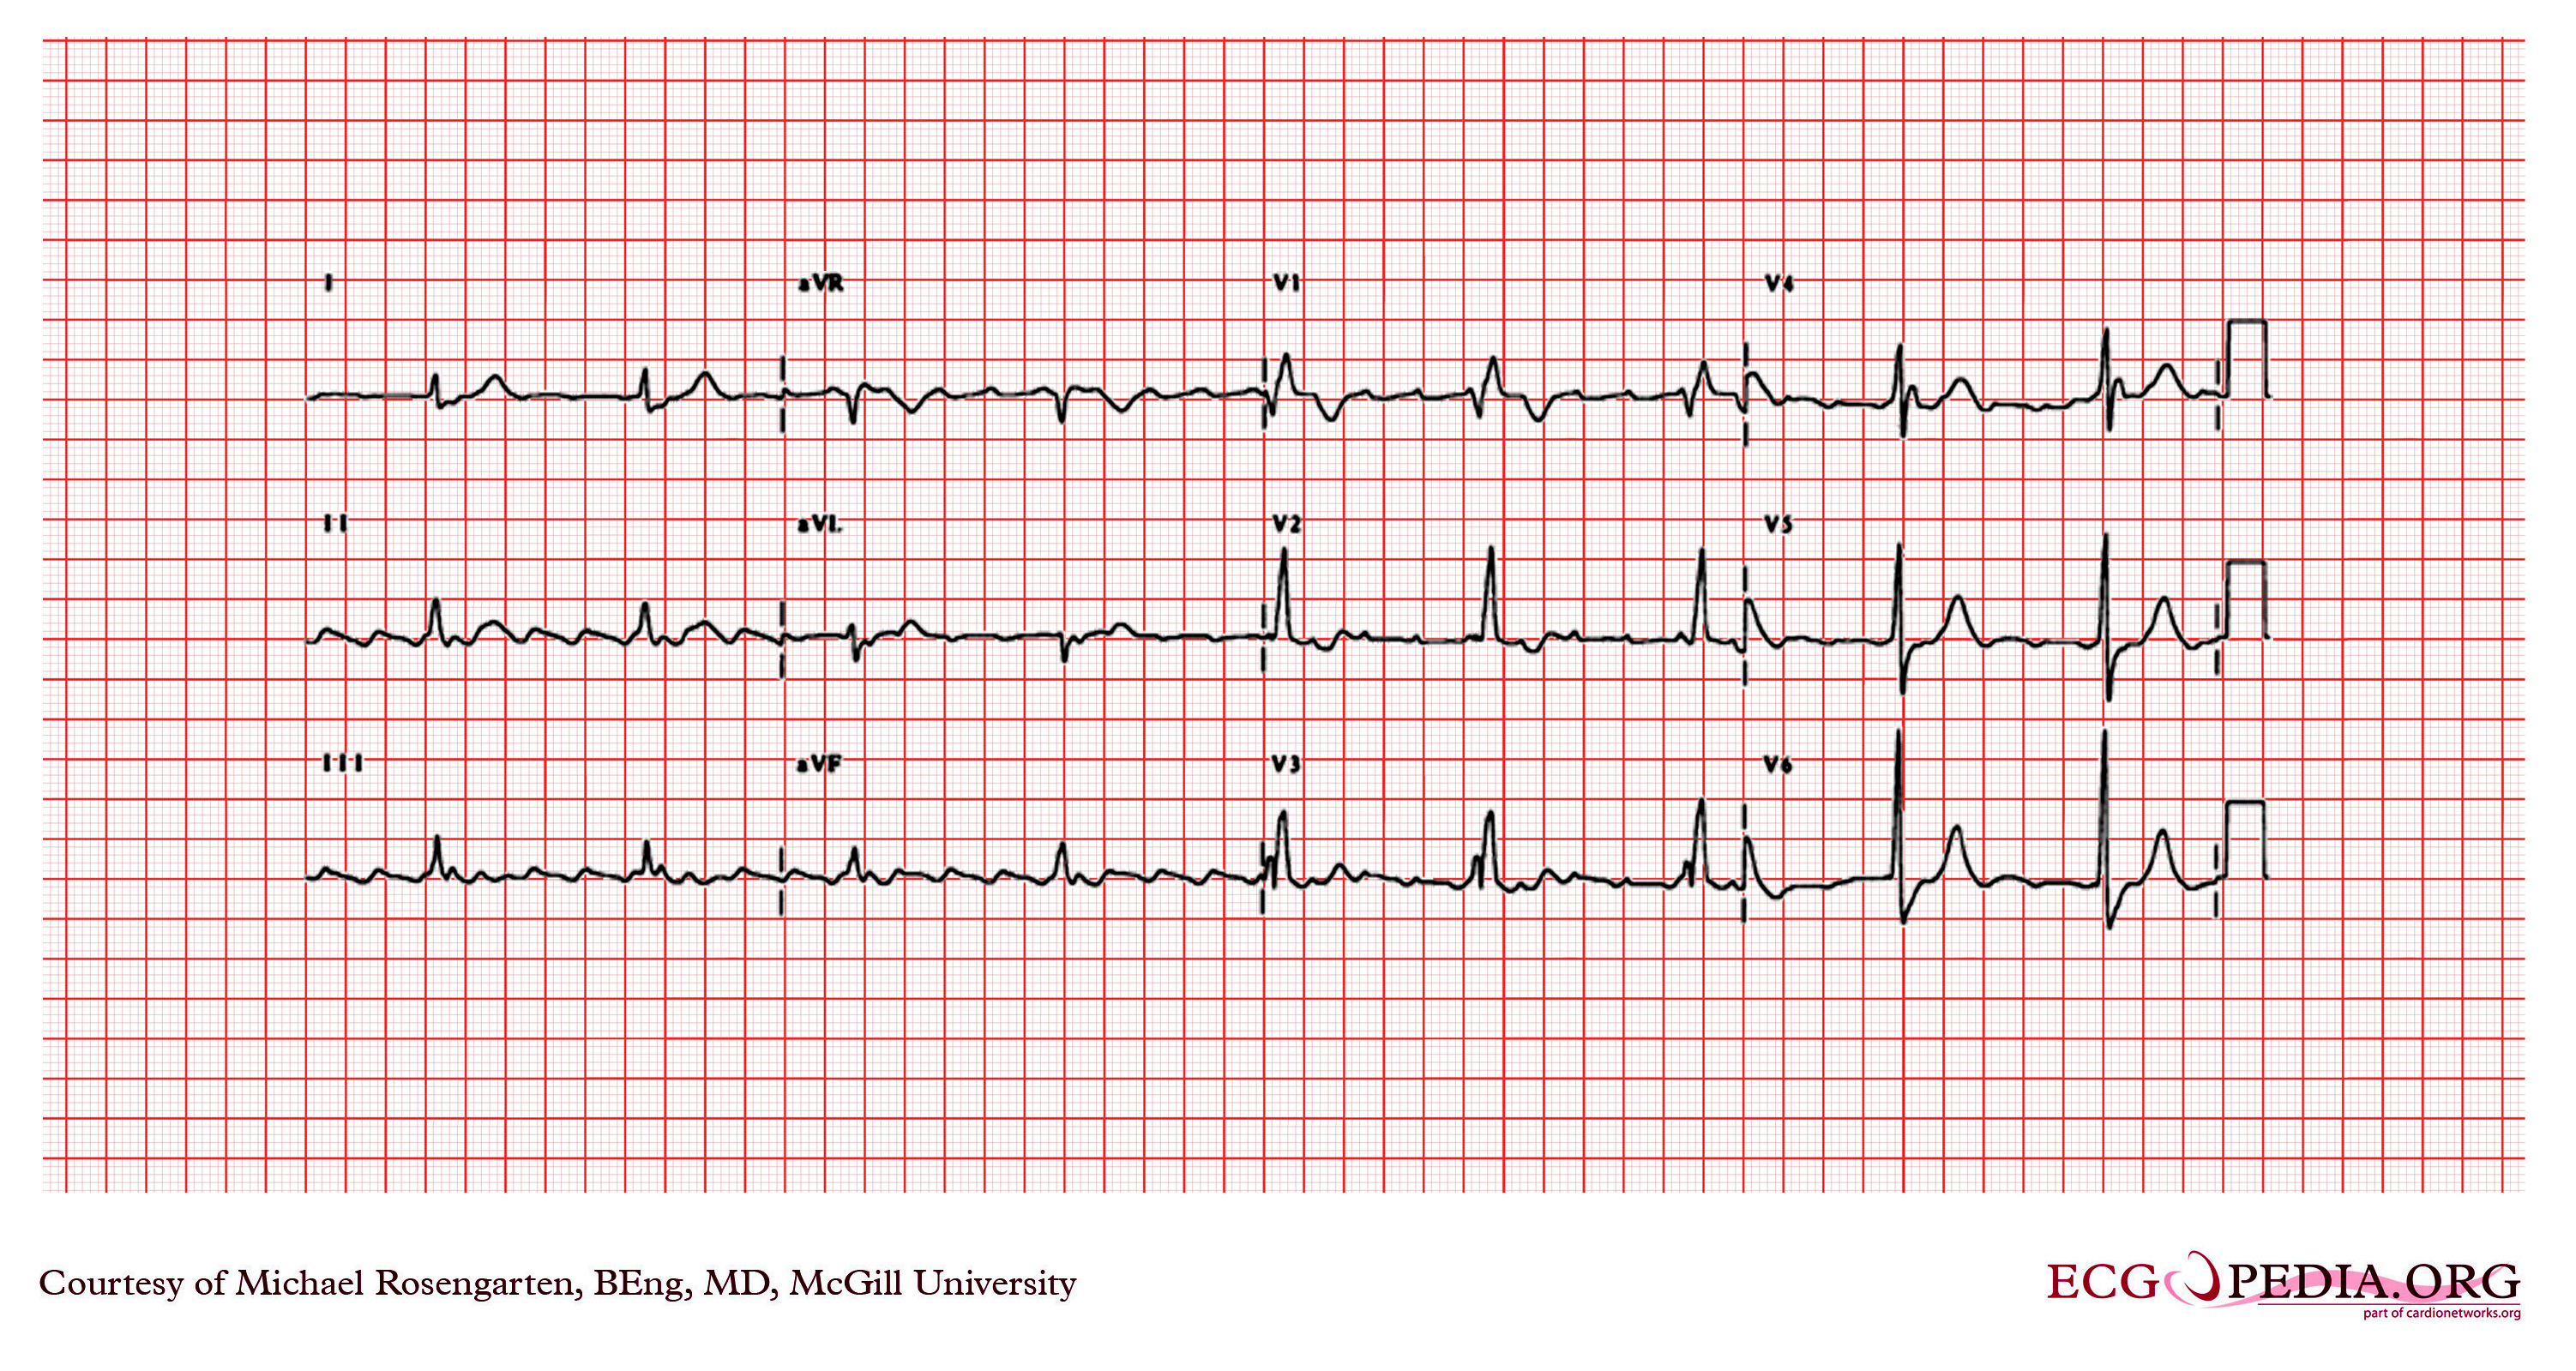
Copyleft image obtained courtesy of ECGpedia, http://en.ecgpedia.org/wiki/File:E201.jpg
Shown below is an EKG depicting atrial tachycardia at about 240/min. (slow atrial flutter?) with 2:1 A/V block. The atrial activity is best seen in leads V1, III and aVF.
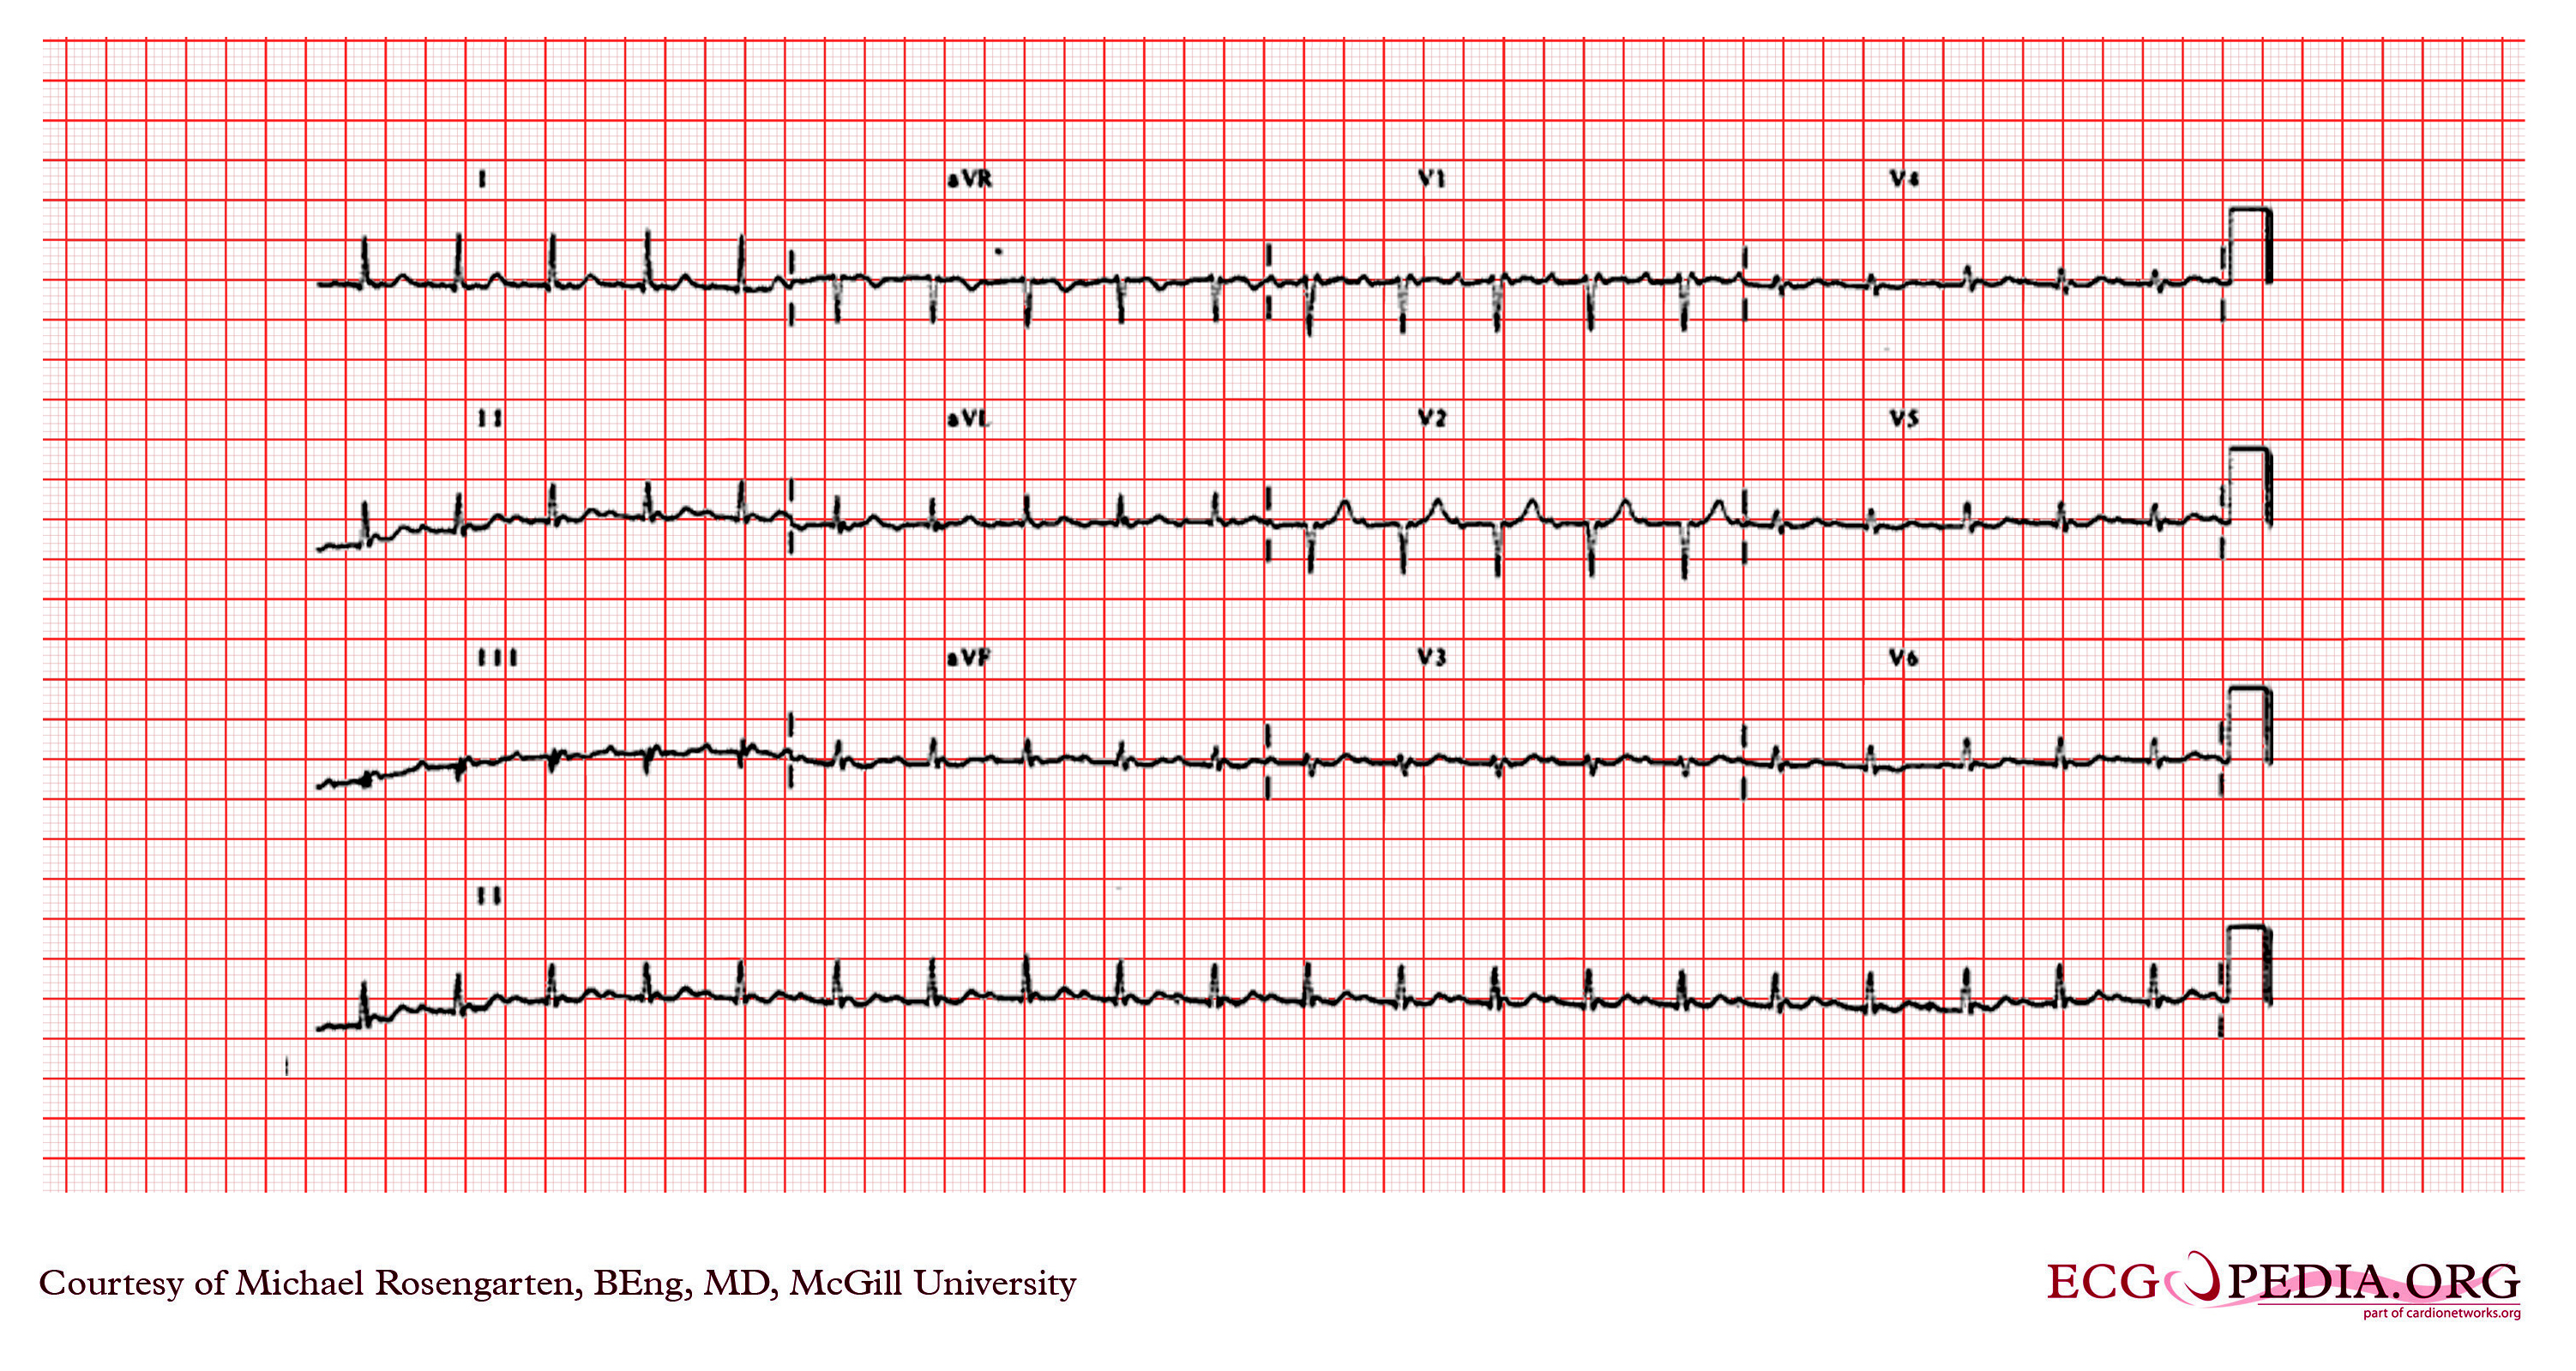
Copyleft image obtained courtesy of ECGpedia, http://en.ecgpedia.org/wiki/File:E0007571.jpg
Shown below is an EKG depicting an atrial flutter in a patient with WPW syndrome. There is 1:1 conduction down a bypass tract.

Copyleft image obtained courtesy of ECGpedia, http://en.ecgpedia.org/wiki/File:ECG_Aflutt_1to1.jpg
References
- ↑ FOSMOE RJ, AVERILL KH, LAMB LE (1960). "Electrocardiographic findings in 67,375 asymptomatic subjects. II. Supraventricular arrhythmias". Am J Cardiol. 6: 84–95. doi:10.1016/0002-9149(60)90039-4. PMID 13824085.