Atomic radiation astronomy
Editor-In-Chief: Henry A. Hoff
Atomics are usually neutral atoms and molecules of a few atoms.
At right is the result of an all Moon survey by the Lunar Prospector using an onboard neutron spectrometer (NS). Cosmic rays impacting the lunar surface generate neutrons which in turn loose much of their energy in collisions with hydrogen atoms trapped within the Moon's surface.[1] Some of these thermal neutrons collide with the helium atoms within the NS to yield an energy signature which is detected and counted.[1] The NS aboard the Lunar Prospector has a surface resolution of 150 km.[1]
Theoretical atomic radiation astronomy
For the determination of the elemental composition of liquid proteins microPIXE can quantify the metal content of protein molecules with a relative accuracy of between 10% and 20%.[2] In part by the X-ray emission from sulfur and the phosphate groups but excessive amounts of chlorine overlap with the sulfur peak; whereas KBr and NaBr do not.
In the image at right, the top image is the plum pudding model of atoms undisturbed by penetrating protons. In the bottom image, some of the protons are deflected.
Entities
"Deuterated isotopomers of methanol have been detected both in hot cores and in the protostellar source IRAS 16293-2422. [...] In studying the post-evaporative gas-phase chemistry of these isotopomers, it is important to know if pairs of isotopomers with D atoms in different places (eg CH3OD and CH2DOH) can be interconverted or whether they can be viewed as separate entities with depletion mechanisms that are independent of each other. Here we show that it is difficult to exchange protons and deuterons on the two different parts of the methanol backbone."[3]
Emissions
"The emission spectrum of atomic hydrogen is divided into a number of spectral series, with wavelengths given by the Rydberg formula. These observed spectral lines are due to electrons moving between energy levels in the atom. The spectral series are important in astronomy for detecting the presence of hydrogen and calculating red shifts. ... [T]he spectral lines of hydrogen correspond to particular jumps of the electron between energy levels. The simplest model of the hydrogen atom is given by the Bohr model. When an electron jumps from a higher energy to a lower, a photon of a specific wavelength is emitted."[4]
The spectral lines are grouped into series according to n'. Lines are named sequentially starting from the longest wavelength/lowest frequency of the series, using Greek letters within each series. For example, the 2 → 1 line is called "Lyman-alpha" (Ly-α), while the 7 → 3 line is called "Paschen-delta" (Pa-δ). Some hydrogen spectral lines fall outside these series, such as the 21 cm line; these correspond to much rarer atomic events such as hyperfine transitions.[5] The fine structure also results in single spectral lines appearing as two or more closely grouped thinner lines, due to relativistic corrections.[6]
The energy differences between levels in the Bohr model, and hence the wavelengths of emitted/absorbed photons, is given by the Rydberg formula[7]:
- <math> {1 \over \lambda} = R \left( {1 \over (n^\prime)^2} - {1 \over n^2} \right) \qquad \left( R = 1.097373 \times 10^7 \ \mathrm{m}^{-1} \right)</math>
where n is the initial energy level, n′ is the final energy level, and R is the Rydberg constant. Meaningful values are returned only when n is greater than n′ and the limit of one over infinity is taken to be zero.
"The familiar red H-alpha [Hα 656 nm] spectral line of hydrogen gas, which is the transition from the shell n = 3 to the Balmer series shell n = 2, is one of the conspicuous colors of the universe. It contributes a bright red line to the spectra of emission or ionization nebula, like the Orion Nebula, which are often H II regions found in star forming regions. In true-color pictures, these nebula have a distinctly pink color from the combination of visible Balmer lines that hydrogen emits."[8]
A hydrogen-alpha filter is an optical filter designed to transmit a narrow bandwidth of light generally centered on the H-alpha wavelength. They are characterized by a bandpass width that measures the width of the wavelength band that is transmitted.[9] These filters are manufactured by multiple (~50) layers of vacuum-deposited layers. These layers are selected to produce interference effects that filter out any wavelengths except at the requisite band.[10] Alternatively, an etalon may be used as the narrow band filter (in conjunction with a "blocking filter" or energy rejection filter) to pass only a narrow (<0.1 nm) range of wavelengths of light centred around the H-alpha emission line. The physics of the etalon and the dichroic interference filters are essentially the same (relying on constructive/destructive interference of light reflecting between surfaces), but the implementation is different (an interference filter relies on the interference of internal reflections). Due to the high velocities sometimes associated with features visible in H-alpha light (such as fast moving prominences and ejections), solar H-alpha etalons can often be tuned (by tilting or changing the temperature) to cope with the associated Doppler effect."[11]
The Balmer series of emission lines from hydrogen occur in the visible spectrum of the Sun at: 397, 410, 434, 486, and 656 nm.
Hydrogen has two emission lines that occur in an electron cyclotron resonance (ECR) heated plasmas at 397.007 nm of the Balmer series (Hε) and 434.05 nm Hγ.[12]
Backgrounds
Def. "ionizing radiation that is naturally present in the environment"[13] is called background radiation.
Background radiation is the ubiquitous ionizing radiation that the general population is exposed to, including natural and artificial sources. Both natural and artificial background radiation varies by location.
The worldwide average natural [effective radiation] dose to humans is about 2.4 millisievert (mSv) per year.[14]
The biggest source of natural background radiation is airborne radon, a radioactive gas that emanates from the ground. Radon and its isotopes, parent radionuclides, and decay products all contribute to an average inhaled dose of 1.26 mSv/a. Radon is unevenly distributed and variable with weather, such that much higher doses apply to many areas of the world, where it represents a significant health hazard. Concentrations over 500 times higher than the world average have been found inside buildings in Scandinavia, the United States, Iran, and the Czech Republic.[15]
Terrestrial radiation usually only includes sources that remain external to the body. The major radionuclides of concern are potassium, uranium and thorium and their decay products, some of which, like radium and radon are intensely radioactive but occur in low concentrations.
An average human contains about 30 milligrams of potassium-40 (40K) and about 10 nanograms (10−8 g) of carbon-14 (14C), which has a decay half-life of 5,730 years. Excluding internal contamination by external radioactive material, the largest component of internal radiation exposure from biologically functional components of the human body is from potassium-40. The decay of about 4,000 nuclei of 40K per second[16] makes potassium the largest source of radiation in terms of number of decaying atoms. The energy of beta particles produced by 40K is also about 10 times more powerful than the beta particles from 14C decay. 14C is present in the human body at a level of 3700 Bq with a biological half-life of 40 days.[17] There are about 1,200 beta particles per second produced by the decay of 14C. However, a 14C atom is in the genetic information of about half the cells, while potassium is not a component of DNA. The decay of a 14C atom inside DNA in one person happens about 50 times per second, changing a carbon atom to one of nitrogen.[18] The global average internal dose from radionuclides other than radon and its decay products is 0.29 mSv/a, of which 0.17 mSv/a comes from 40K, 0.12 mSv/a comes from the uranium and thorium series, and 12 μSv/a comes from 14C.[14]
Background radiation may simply be any radiation that is pervasive, whether ionizing or not. A particular example of this is the cosmic microwave background radiation, a nearly uniform glow that fills the sky in the microwave part of the spectrum; stars, galaxies and other objects of interest in radio astronomy stand out against this background.
In a laboratory, background radiation refers to the measured value from any sources that affect an instrument when a radiation source sample is not being measured. This background rate, which must be established as a stable value by multiple measurements, usually before and after sample measurement, is subtracted from the rate measured when the sample is being measured.
Cosmic rays
Def. cosmic rays that are created when primary cosmic rays interact with interstellar matter are called secondary cosmic rays.
Carbon and oxygen nuclei collide with interstellar matter to form lithium, beryllium and boron in a process termed cosmic ray spallation. Spallation is also responsible for the abundances of scandium, titanium, vanadium, and manganese ions in cosmic rays produced by collisions of iron and nickel nuclei with interstellar matter.
Observations of the lunar shadowing of galactic cosmic rays (GCRs) has demonstrated that there does not appear to be an antiproton component of the galactic cosmic rays, but the antiprotons detected are instead produced by the GCR interaction with interstellar hydrogen gas.[19]
For an interstellar medium "composed of 90% H and 10% He, [with a density of 0.3 atoms cm-3] and using the most recently measured cross sections (Webber, 1989; Ferrando et al., 1988b), the escape length has been found equal to 34βR-0.6 g cm-2 for rigidities R above 4.4 GV, and 14β g cm-2 below. ... where R and β are the interstellar values of the rigidity and the ratio of the velocity of the particle to the velocity of light."[20]
About 89% of cosmic rays are simple protons or hydrogen nuclei, 10% are helium nuclei or alpha particles, and 1% are the nuclei of heavier elements. Solitary electrons constitute much of the remaining 1%.
In cosmic-ray astronomy, cosmic rays are not charge balanced; that is, positive ions heavily outnumber electrons.
Aluminium-26, 26Al, is a radioactive isotope of the chemical element aluminium, decaying by either of the modes beta-plus or electron capture, both resulting in the stable nuclide magnesium-26. The half-life of 26Al is 7.17Template:E years. This is far too short for the isotope to survive to the present, but a small amount of the nuclide is produced by collisions of argon atoms with cosmic ray protons.
Anomalous cosmic rays
{{fairuse}}"While interstellar plasma is kept outside the heliosphere by an interplanetary magnetic field, the interstellar neutral gas flows through the solar system like an interstellar wind, at a speed of 25 km/sec. When closer to the Sun, these atoms undergo the loss of one electron in photo-ionization or by charge exchange. Photo-ionization is when an electron is knocked off by a solar ultra-violet photon, and charge exchange involves giving up an electron to an ionized solar wind atom. Once these particles are charged, the Sun's magnetic field picks them up and carries them outward to the solar wind termination shock. They are called pickup ions during this part of their trip."[21]
"The ions repeatedly collide with the termination shock, gaining energy in the process. This continues until they escape from the shock and diffuse toward the inner heliosphere. Those that are accelerated are then known as anomalous cosmic rays."[21]
"ACRs [may] represent a sample of the very local interstellar medium. They are not thought to have experienced such violent processes as GCRs, and they have a lower speed and energy. ACRs include large quantities of helium, oxygen, neon, and other elements with high ionization potentials, that is, they require a great deal of energy to ionize, or form ions. ACRs are a tool for studying the movement of energetic particles within the solar system, for learning the general properties of the heliosphere, and for studying the nature of interstellar material itself."[21]
Neutrals
Neutrals astronomy is the astronomy of observing neutral atoms or molecules, their sources and apparent entities or objects of origin.
Subatomics
Def. the "lightest and most common isotope of hydrogen, having a single proton and no neutrons- 1
1H"[22] is called protium.
Def. an "isotope of hydrogen formed of one proton and one neutron in each atom - 2
1H"[23] is called deuterium.
"Heavy water is “heavy” because it contains deuterium."[23]
"There were about 80 deuteriums for every million protiums, and virtually no tritium."[23]
Def. a "radioactive isotope of the element hydrogen, (symbol T or 3
1H), having one proton and two neutrons"[24] is called tritium.
Def. a "highly unstable, synthetic isotope of the element hydrogen, 4
1H, having one proton and three neutrons"[25] is called quadrium.
1
1H(p,β+ν)2
1H
- <math>\mathrm{_1^1H} + \mathrm{_1^1H} \rightarrow \mathrm{_{1}^{2}D} + e^+ + \nu_e + \gamma (0.42 MeV). </math>
At 10-million-kelvin, hydrogen fuses to form helium in the proton-proton chain reaction:[26]
- 41
1H → 22
1H + 2e+ + 2νe (4.0 MeV + 1.0 MeV) - 21
1H + 22
1H → 23
2He + 2γ (5.5 MeV) - 23
2He → 4
2He + 21
1H (12.9 MeV)
These reactions result in the overall reaction:
- 41
1H → 4
2He + 2e+ + 2γ + 2νe (26.7 MeV)
where e+ is a positron, γ is a gamma ray photon, νe is a neutrino, and H and He are isotopes of hydrogen and helium, respectively. The energy released by this reaction is in millions of electron volts, which is actually only a tiny amount of energy.
"The light elements deuterium, lithium, beryllium, and boron pose a special problem for any theory of the origin of the elements which proposes that all the elements are built up from hydrogen in the stars. ... The difficulty arises because the lifetimes of these elements against proton capture, at the temperatures and pressures at which most stellar matter exists, are short compared to the stable lifetimes of stars. These elements then cannot be produced in stellar interiors unless they are transported rapidly to the surface, and if they are produced at the surface, non-equilibrium processes must be involved. Further, they can exist in significant quantities at the surface only in the absence of rapid mixing to the interior."[27]
Positrons
"The positrons can annihilate in flight before being slowed to thermal energies, annihilate directly with electrons when both are at thermal energies, or form positronium at thermal energies (or at greater than thermal energies if positronium formation occurs via charge exchange with neutrals)."[28]
"Positrons entering a gaseous medium at [0.6 to 4.5 MeV] are quickly slowed by ionizing collisions with neutral atoms and by long-range Coulomb interactions with any ionized component."[28]
Gamma rays
In gamma-ray astronomy, "when cosmic rays [such as protons] interact with ordinary matter ... pair-production gamma rays at 511 keV" [are produced that are included in] the gamma ray background.[29]
"Nuclear reaction analysis (NRA) is a nuclear method in materials science to obtain concentration vs. depth distributions for certain target chemical elements in a solid thin film."[30]
"If irradiated with select projectile nuclei [or protons] at kinetic energies Ekin these target elements can undergo a nuclear reaction under resonance conditions for a sharply defined resonance energy. The reaction product is usually a nucleus in an excited state which immediately decays, emitting ionizing radiation such as protons or gamma rays."[30]
"To obtain depth information the initial kinetic energy of the projectile nucleus (which has to exceed the resonance energy) and its stopping power (energy loss per distance traveled) in the sample has to be known. To contribute to the nuclear reaction the projectile nuclei have to slow down in the sample to reach the resonance energy. Thus each initial kinetic energy corresponds to a depth in the sample where the reaction occurs (the higher the energy, the deeper the reaction)."[30]
"A commonly used reaction is
with a resonance at 6.385 MeV."[30]
"The energetic emitted γ ray is characteristic of the reaction and the number that are detected at any incident energy is proportional to the concentration at the respective depth of [nitrogen] in the sample. The N concentration profile is then obtained by scanning the proton incident or transmitted beam energy."[30]
"NRA can also be used non-resonantly. For example, deuterium can easily be profiled with a 3He beam [or 3He with a deuterium beam] without changing the incident energy by using the
- 3He + D = α + p+ + 18.353 MeV
reaction. The energy of the fast proton detected depends on the depth of the deuterium [or 3He] atom in the sample."[30]
X-rays
"In X-ray wavelengths, many scientists are investigating the scattering of X-rays by interstellar dust, and some have suggested that astronomical X-ray sources would possess diffuse haloes, due to the dust.[31]
X-rays remove electrons from atoms and ions, and those photoelectrons can provoke secondary ionizations. As the intensity is often low, this [X-ray] heating is only efficient in warm, less dense atomic medium (as the column density is small). For example in molecular clouds only hard x-rays can penetrate and x-ray heating can be ignored. This is assuming the region is not near an x-ray source such as a supernova remnant.
Ultraviolets
"[T]he Lyman series is the series of transitions and resulting ultraviolet emission lines of the hydrogen atom as an electron goes from n ≥ 2 to n = 1 (where n is the principal quantum number referring to the energy level of the electron)."[32]
"The version of the Rydberg formula that generated the Lyman series was[33]:
- <math> {1 \over \lambda} = R_H \left( 1 - {1 \over n^2} \right) \qquad \left( R_H = 1.0968 \times 10^7 \mbox{m}^{-1} = {13.6eV \over hc} \right)</math>
Where n is a natural number greater than or equal to 2 (i.e. n = 2,3,4,...).
Therefore, the lines seen in the image above are the wavelengths corresponding to <math>n=2\,</math> on the right, to <math>n= \infty </math> on the left (there are infinitely many spectral lines, but they become very dense as they approach to <math>n= \infty </math> (Lyman limit), so only some of the first lines and the last one appear).
The wavelengths (nm) in the Lyman series are all ultraviolet:"[32]
| <math>n</math> | 2 | 3 | 4 | 5 | 6 | 7 | 8 | 9 | 10 | 11 | <math>\infty</math> |
|---|---|---|---|---|---|---|---|---|---|---|---|
| Wavelength (nm) | 121.6 | 102.6 | 97.3 | 95.0 | 93.8 | 93.1 | 92.6 | 92.3 | 92.1 | 91.9 | 91.18 (Lyman limit) |
"In 1913, when Niels Bohr produced his Bohr model theory, the reason why hydrogen spectral lines fit Rydberg's formula was explained. Bohr found that the electron bound to the hydrogen atom must have quantized energy levels described by the following formula:
- <math> E_n = - {{m e^4} \over {2 \left( 4 \pi \varepsilon_0 \hbar \right)^2}} {1 \over n^2} = - {13.6 \over n^2} [\mbox{eV}]. </math>
According to Bohr's third assumption, whenever an electron falls from an initial energy level(<math> E_i </math>) to a final energy level(<math> E_f </math>), the atom must emit radiation with a wavelength of:
- <math> \lambda = {{h c} \over {E_i - E_f}}. </math>
There is also a more comfortable notation when dealing with energy in units of electronvolts and wavelengths in units of angstroms:
- <math> \lambda = {12430 \over {E_i - E_f}}. </math>
Replacing the energy in the above formula with the expression for the energy in the hydrogen atom where the initial energy corresponds to energy level n and the final energy corresponds to energy level m:
- <math> {1 \over \lambda} = {{E i-E f} \over 12430} = \left( {12430 \over 13.6} \right)^{-1} \left({1 \over m^2} - {1 \over n^2} \right) = R \left({1 \over m^2} - {1 \over n^2} \right) </math>
where R_H is the same Rydberg constant for hydrogen of Rydberg's long known formula.
For the connection between Bohr, Rydberg, and Lyman, one must replace m by 1 to obtain:
- <math> {1 \over \lambda} = R_H \left( 1 - {1 \over n^2} \right) </math>
which is Rydberg's formula for the Lyman series. Therefore, each wavelength of the emission lines corresponds to an electron dropping from a certain energy level (greater than 1) to the first energy level."[32]
Blues
"The light blue background is the dayglow emission (less than 1 kR) caused by the interaction between the photoelectrons generated by solar UV radiation and atmospheric molecules and atoms."[34] This background occurs when imaging an Earth aurora from space using ultraviolet astronomy at the VUV wavelengths (135.6 ± 1.5 nm and 149.3 ± 1.5 nm).
Submillimeters
"[T]he detection of absorption by interstellar hydrogen fluoride (HF) [in the submillimeter band occurs] along the sight line to the submillimeter continuum sources W49N and W51."[35]
"HF is the dominant reservoir of fluorine wherever the interstellar H2/atomic H ratio exceeds ~ 1; the unusual behavior of fluorine is explained by its unique thermochemistry, F being the only atom in the periodic table that can react exothermically with H2 to form a hydride."[35]
The observations "toward W49N and W51 [occurred] on 2010 March 22 ... The observations were carried out at three different local oscillator (LO) tunings in order to securely identify the HF line toward both sight lines. The dual beam switch mode (DBS) was used with a reference position located 3' on either side of the source position along an East-West axis. We centered the telescope beam at α =19h10m13.2s, δ = 09°06'12.0" for W49N and α = 19h23m43.9s, δ = 14°30'30.5" for W51 (J2000.0). The total on-source integration time amounts to 222s on each source using the Wide Band Spectrometer (WBS) that offers a spectral resolution of 1.1 MHz (~0.3 km s-1 at 1232 GHz)."[35]
"[T]he first detection of chloronium, H2Cl+, in the interstellar medium, [occurred on March 1 and March 23, 2010,] using the HIFI instrument aboard the Herschel Space Observatory. The 212 − 101 lines of ortho-H235Cl+ and ortho-H237Cl+ are detected in absorption towards NGC 6334I, and the 111 − 000 transition of para-H235Cl+ is detected in absorption towards NGC 6334I and Sgr B2(S)."[36]
"The [microwave] detection of interstellar formaldehyde provides important information about the chemical physics of our galaxy. We now know that polyatomic molecules containing at least two atoms other than hydrogen can form in the interstellar medium."[37] "H2CO is the first organic polyatomic molecule ever detected in the interstellar medium".[37]
Radios
CO is such a common interstellar molecule that it is used to map out molecular regions.[38] The radio observation of perhaps greatest human interest is the claim of interstellar glycine,[39] the simplest amino acid, but with considerable accompanying controversy.[40]
Plasma objects
"In 1951, prior to the Space Age, the existence of energetic neutral hydrogen atoms (as high as 70 keV in energy) in space plasma was discovered."[42]
"Plasma is the fourth state of matter, consisting of electrons, ions and neutral atoms, usually at temperatures above 104 degrees Kelvin."[43]
"ENA imaging permits study of the ways in which our entire plasma environment -- including the magnetopause, ring current, plasmasphere, auroral zones, plasma sheet, and the ionosphere -- reacts to the changing conditions of the solar wind (Williams, 1990)."[42]
Diatomic gases
Molecular hydrogen gas is excited in the discharge tube shown on the right. When an electron returns to a lower energy orbital state the purple color is observed.
"Molecular hydrogen (H2) [is] a colourless, odourless and flammable gas at room temperature."[44]
"The familiar red H-alpha [Hα 656 nm] spectral line of hydrogen gas, which is the transition from the shell n = 3 to the Balmer series shell n = 2, is one of the conspicuous colors of the universe. It contributes a bright red line to the spectra of emission or ionization nebula, like the Orion Nebula, which are often H II regions found in star forming regions. In true-color pictures, these nebula have a distinctly pink color from the combination of visible Balmer lines that hydrogen emits."[8]
A "high-resolution spectrum of the Becklin-Neugebauer (BN) infrared point source located in [the region of the Orion Nebula] ... with the Steward Observatory 2.29 m (90 inch) telescope ... [confirmed] the reality of [the 2.12 μ] line ... on 1976 January 15 and 16. The line was then identified by R. Treffers as the S(1) line of the 1-0 vibration-rotation quadrupole spectrum of H2. Six other lines of the same band were also found. The presence of two of our lines has been confirmed by Grasdalen and Joyce (1976). Electronic transitions of interstellar H2 have previously been observed in the ultraviolet (Carruthers 1970; Smith 1973; Spitzer et al. 1973)."[45]
Diatomic hydrogen gas apparently exists in two distinct forms which can mix: orthohydrogen and parahydrogen. On the right is a graph of molar energies of orthohydrogen and parahydrogen, plus an equilibrium mixture obtained when a catalyst is present to allow for ortho-para interconversion. The curve marked 3:1 is the ortho:para ratio at room temperature that will persist if no catalyst is present during cooling. Orthohydrogen has the spins of the two protons parallel while para hydrogen has them antiparallel.
The second graph shows the molar heat capacities for the same gases versus temperature.
Rocky objects
There are many advantages to using a proton beam over an electron beam:
- There is less crystal charging from Bremsstrahlung radiation, although there is some from the emission of Auger electrons,
- there is significantly less than if the primary beam was itself an electron beam, and
- because of the higher mass of protons relative to electrons, there is less lateral deflection of the beam.
Rutherford backscattering spectrometry (RBS) is an analytical technique sometimes referred to as high-energy ion scattering (HEIS) spectrometry. RBS is used to determine the structure and composition of materials by measuring the backscattering of a beam of high energy protons or ions impinging on a piece of material such as a dust grain.
If the energy of the incident proton is increased sufficiently, the Coulomb barrier is exceeded and the wavefunctions of the incident and struck particles overlap. This may result in nuclear reactions in certain cases, but frequently the interaction remains elastic, although the scattering cross-sections may fluctuate wildly as a function of energy. This case is known as "Elastic (non-Rutherford) Backscattering Spectrometry" (EBS).
We can describe Rutherford backscattering as an elastic (hard-sphere) collision between a high kinetic energy proton from the incident beam (the projectile) and a stationary particle located in the dust grain (the target). Elastic in this context means that no energy is either lost or gained during the collision.
In some circumstances a collision may result in a nuclear reaction, with the release of considerable energy. Nuclear reaction analysis (NRA) is very useful for detecting light elements.
The energy E1 of the scattered projectile is reduced from the initial energy E0:
- <math>E_1 = k \cdot E_0, </math>
where k is known as the kinematical factor, and
- <math>k = \left(\frac{m_1 \cos{\theta_1} \pm \sqrt{m_2^2 - m_1^2(\sin{\theta_1})^2}}{m_1 + m_2}\right)^2,</math>[46]
where particle 1 is the projectile, particle 2 is the target nucleus, and <math>\theta_1</math> is the scattering angle of the projectile in the laboratory frame of reference (that is, relative to the observer). The plus sign is taken when the mass of the projectile is less than that of the target, otherwise the minus sign is taken.
To describe the probability of observing such an event. For that we need the differential cross-section of the backscattering event:
- <math>\frac{d\omega}{d\Omega} = \left(\frac{Z_1Z_2e^2}{4E_0}\right)^2
\frac{1}{\left(\sin{\theta/2}\right)^4},</math>[46]
where <math>Z_1</math> and <math>Z_2</math> are the atomic numbers of the incident [proton] and target [nucleus]. [From] the centre of mass frame of reference and is therefore not a function of the mass of either the projectile or the target nucleus.
The "scattering angle <math>\theta_1</math> is not the same as the scattering angle <math>\theta</math> (although for RBS experiments they are usually very similar).
A scattering cross-section is zero implies that the projectile never comes close to the target, nor penetrates the electron cloud surrounding the nucleus. The pure Coulomb formula for the scattering cross-section shown above must be corrected for this screening effect, which becomes more important as the energy of the projectile decreases.
While large-angle scattering only occurs for protons which scatter off target nuclei, inelastic small-angle scattering can also occur off the sample electrons. This results in a gradual decrease in protons which penetrate more deeply into the sample, so that backscattering off interior nuclei occurs with a lower "effective" incident energy. The amount by which the ion energy is lowered after passing through a given distance is referred to as the stopping power of the material and is dependent on the electron distribution. This energy loss varies continuously with respect to distance traversed, so that stopping power is expressed as
- <math>S(E) = -{dE \over dx}. </math>[47]
For high energy stopping power is usually proportional to <math>\frac{Z_2}{E}</math>.
Stopping power or, stopping force has units of energy per unit length. It is generally given in thin film units, that is eV /(atom/cm2) since it is measured experimentally on thin films whose thickness is always measured absolutely as mass per unit area, avoiding the problem of determining the density of the material which may vary as a function of thickness. Stopping power is now known for all materials at around 2%, see http://www.srim.org.
When a beam of protons with parallel trajectories is incident on a target atom, scattering off that atom prevents or blocks collisions in a cone-shaped region "behind" the target relative to the beam. This occurs because the repulsive potential of the target atom bends close ion trajectories away from their original path. The radius of this blocked region, at a distance L from the original atom, is given by
- <math>R = 2\sqrt{\frac{Z_1Z_2e^2L}{E_0}}</math>[48]
When a proton is scattered from deep inside a sample, it can then re-scatter off a second atom, creating a second blocked cone in the direction of the scattered trajectory. This can be detected by carefully varying the detection angle relative to the incident angle.
Channeling is observed when the incident beam is aligned with a major symmetry axis of the crystal. Incident protons which avoid collisions with surface atoms are excluded from collisions with all atoms deeper in the sample, due to blocking by the first layer of atoms. When the interatomic distance is large compared to the radius of the blocked cone, the incident protons can penetrate many times the interatomic distance without being backscattered. This can result in a drastic reduction of the observed backscattered signal when the incident beam is oriented along one of the symmetry directions, allowing determination of a sample's regular crystal structure. Channeling works best for very small blocking radii, i.e. for protons.
The tolerance for the deviation of the [proton] beam angle of incidence relative to the symmetry direction depends on the blocking radius, making the allowable deviation angle proportional to
- <math>\sqrt{\frac{Z_1Z_2}{E_0d}}</math>[49]
While the intensity of an RBS peak is observed to decrease across most of its width when the beam is channeled, a narrow peak at the high-energy end of a larger peak will often be observed, representing surface scattering from the first layer of atoms. The presence of this peak opens the possibility of surface sensitivity for RBS measurements.
Hydrogens
Proton–hydrogen charge-exchange collisions [such as those shown at right] are often the most important process in space plasma because hydrogen is the most abundant constituent of both plasmas and background gases and hydrogen charge-exchange occurs at very high velocities involving little exchange of momentum.
The "efforts to study the 21 cm hydrogen line from the northern and southern hemispheres in 1954 and 1959 [...] were combined and provided the first full-galaxy radio map of neutral hydrogen in the Milky Way".[50]
A hydrogen atom is about 0.11 nm in diameter.
The "relative motion in a hydrogen atom in crossed electric and magnetic fields leads to peculiar quasi-ionized states with an electron localized very far from a proton."[51]
The Solar Wind Anisotropies (SWAN) aboard SOHO "is the only remote sensing instrument on SOHO that does not look at the Sun. It watches the rest of the sky, measuring hydrogen that is ‘blowing’ into the Solar System from interstellar space. By studying the interaction between the solar wind and this hydrogen gas, SWAN determines how the solar wind is distributed. As such, it can be qualified as SOHO’s solar wind ’mapper’."[52]
1H, the most commonly used spin ½ nucleus in NMR investigation, has been studied using many forms of NMR. Hydrogen is highly abundant, especially in biological systems. It is the nucleus most sensitive to NMR signal (apart from 3H which is not commonly used due to its instability and radioactivity). Proton NMR produces narrow chemical shift with sharp signals. Fast acquisition of quantitative results (peak integrals in stoichiometric ratio) is possible due to short relaxation time.
[NMR widely used in chemical studies, notably in NMR spectroscopy such as proton NMR, carbon-13 NMR, deuterium NMR and phosphorus-31 NMR.
"Proton NMR ( Hydrogen-1 NMR, or 1H NMR) is the application of nuclear magnetic resonance in NMR spectroscopy with respect to hydrogen-1 nuclei within the molecules of a substance, in order to determine the structure of its molecules.[53] In samples where natural hydrogen (H) is used, practically all of the hydrogen consists of the isotope 1H (hydrogen-1; i.e. having a proton for a nucleus). A full 1H atom is called protium.
Lithium nuclei
The "evidence for the overwhelming majority of the Li-atoms in photospheres has its origin not only in nuclear synthesis near the stellar centers, but also by active processes in stellar atmospheres. [...] the lithium [resonance] line [is] near 478 keV."[54]
"Approximately 90% of lithium atoms originate from α - α reactions for the typical spectra of an accelerated particles on the Sun [...] During impulsive flares, interaction between the accelerated particles and the ambient medium occurs mainly at low altitudes, i.e., close to the footprints of loops."[54]
Nitrogen nuclei
"For cosmic rays the low abundance ”valleys” in the solar system composition around Z=4, 21, 46, and 70 are not present. This is usually believed to be the result of spallation of heavier nuclei during their propagation through the galaxy. Hydrogen, helium, and the CNO–group are suppressed in cosmic rays. This has been explained by the high first ionization potential of these atoms [63] or by the high volatility of these elements which do not condense on interstellar grains [64]. Which property is the right descriptor of cosmic–ray abundances has proved elusive, however, the volatility seems to become the more accepted solution [65]."[55]
Metallicities
For stars, the metallicity is often expressed as "[Fe/H]", which represents the logarithm of the ratio of a star's iron abundance compared to that of the Sun (iron is not the most abundant heavy element, but it is among the easiest to measure with spectral data in the visible spectrum). The formula for the logarithm is expressed thus:
Template:Center top<math> [\mathrm{Fe}/\mathrm{H}] = \log_{10}{\left(\frac{N_{\mathrm{Fe}}}{N_{\mathrm{H}}}\right)_{star}} - \log_{10}{\left(\frac{N_{\mathrm{Fe}}}{N_{\mathrm{H}}}\right)_{sun}} </math>Template:Center bottom
where <math>N_{\mathrm{Fe}}</math> and <math>N_{\mathrm{H}}</math> are the number of iron and hydrogen atoms per unit of volume respectively. The unit often used for metallicity is the "dex" which is a (now-deprecated) contraction of decimal exponent.[56] By this formulation, stars with a higher metallicity than the Sun have a positive logarithmic value, while those with a lower metallicity than the Sun have a negative value. The logarithm is based on powers of ten; stars with a value of +1 have ten times the metallicity of the Sun (101). Conversely, those with a value of -1 have one tenth (10 −1), while those with -2 have a hundredth (10−2), and so on.[57] Young Population I stars have significantly higher iron-to-hydrogen ratios than older Population II stars. Primordial Population III stars are estimated to have a metallicity of less than −6.0, that is, less than a millionth of the abundance of iron which is found in the Sun.
Astrophysics
Def. a cavity filled with hot gas blown into the interstellar medium by stellar winds is called an astrosphere.
Def. the study of interstellar atoms and molecules and their interaction with radiation [is] called molecular astrophysics.
Sun
As stars are defined as luminous balls of plasma, the Sun may not qualify as its photosphere has a plasma concentration of approximately 10-4. The rest is composed of neutral atoms at about 5800 K.
The visible light we see is produced as electrons react with hydrogen atoms to produce H− ions.[58][59]
"The production and escape of hot ions (H+ and H+2) and hot atomic hydrogen by stellar ultraviolet radiation is ... likely".[60]
Heliognosy
Depending primarily upon gas temperature, the presence of gas may be used to determine the composition of the gas object observed, at least the outer layer. Early spectroscopy[61] of the Sun using estimates of "the line intensities of several lines by eye [to derive] the abundances of ... elements ... [concluded] that the Sun [is] largely made of hydrogen."[62]
As temperature increases in an astronomical object composed of H2 gas, the molecules begin to dissociate.
"At a temperature of 8000 K, hydrogen gas is 99.99 percent monatomic."[63]
- <math> \rho_H = \rho_{H_0} e^{E_T/{kT}},</math>
where <math>\rho_{H_0}</math> is an initial concentration [H] at low temperatures as partial particle density, <math>E_T</math> is the dissociation energy 4.52 eV, k is Boltzmann's contant (8.6173324(78)×10−5 eV K-1), and T is temperature in K.
Using
- <math> [H] = 70400 e^{-4.52/(0.00008617T)}</math>
- what is the concentration of H ([H]) at T = 8000 K?
- what is [H] at T = 800 K?
- at what temperature is [H] = 1?
- what is [H] at T = 5778 K?
At 5778 K [H] = 8 %.
Venus
The first ever X-ray image of Venus is shown at right. The "half crescent is due to the relative orientation of the Sun, Earth and Venus. The X-rays from Venus are produced by fluorescent radiation from oxygen and other atoms in the atmosphere between 120 and 140 kilometers above the surface of the planet. In contrast, the optical light from Venus is caused by the reflection from clouds 50 to 70 kilometers above the surface. Solar X-rays bombard the atmosphere of Venus, knock electrons out of the inner parts of atoms, and excite the atoms to a higher energy level. The atoms almost immediately return to their lower energy state with the emission of a fluorescent X-ray. A similar process involving ultraviolet light produces the visible light from fluorescent lamps."[64]
Earth
"Energetic neutral atoms (ENA), emitted from the magnetosphere with energies of ∼50 keV, have been measured with solid-state detectors on the IMP 7/8 and ISEE 1 spacecraft. The ENA are produced when singly charged trapped ions collide with the exospheric neutral hydrogen geocorona and the energetic ions are neutralized by charge exchange."[65]
"The IMAGE mission ... High Energy Neutral Atom imager (HENA) ... images [ENAs] at energies between 10 and 60 keV/nucleon [to] reveal the distribution and the evolution of energetic [ions, including protons] as they are injected into the ring current during geomagnetic storms, drift about the Earth on both open and closed drift paths, and decay through charge exchange to pre‐storm levels."[66]
Airglows
In the International Space Station image at right, you can "see green and yellow airglow paralleling the Earth’s horizon line (or limb) before it is overwhelmed by the light of the rising Sun. Airglow is the emission of light by atoms and molecules in the upper atmosphere after they are excited by ultraviolet radiation. ... Astronaut photograph ISS030-E-015491 was acquired on December 22, 2011, with a Nikon digital camera, and is provided by the ISS Crew Earth Observations experiment and Image Science & Analysis Laboratory, Johnson Space Center."[67]
Airglow (also called nightglow) is the very weak emission of light by a planetary atmosphere. In the case of Earth's atmosphere, this optical phenomenon causes the night sky to never be completely dark (even after the effects of starlight and diffused sunlight from the far side are removed).
Airglow is caused by various processes in the upper atmosphere, such as the recombination of ions which were photoionized by the sun during the day, luminescence caused by cosmic rays striking the upper atmosphere, and chemiluminescence caused mainly by oxygen and nitrogen reacting with hydroxyl ions at heights of a few hundred kilometers. It is not noticeable during the daytime because of the scattered light from the Sun.
Auroras
.jpg)
"When the charged particles from the Sun penetrate Earth's magnetic shield, they are channelled downwards along the magnetic field lines until they strike atoms of gas high in the atmosphere. Like a giant fluorescent neon lamp, the interaction with excited oxygen atoms generates a green or, more rarely, red glow in the night sky, while excited nitrogen atoms yield blue and purple colours."[68]
"Pulsating auroras are so-called because their features shift and brighten in distinct patches, rather than elongated arcs across the sky like active auroras. However, their appearance isn't the only difference. Though all auroras are caused by energetic particles--typically electrons--speeding down into Earth's atmosphere and colliding brilliantly with the atoms and molecules in the air, the source of these electrons is different for pulsating auroras and active auroras."[69]
The "density of neutral atoms within the atmosphere can change throughout the day because of heating by sunlight, the original understanding was that the heating—and the extra-dense layers of neutral particles—was driven horizontally. However, some satellites have hit speed bumps as they have orbited through Earth’s magnetic cusp—their acceleration briefly slowed, which indicates a small vertical slice of higher-density neutral atoms that are harder to travel through."[70]
"Auroras are produced by solar storms that eject clouds of energetic charged particles. These particles are deflected when they encounter the Earth’s magnetic field, but in the process large electric voltages are created. Electrons trapped in the Earth’s magnetic field are accelerated by these voltages and spiral along the magnetic field into the polar regions. There they collide with atoms high in the atmosphere and emit X-rays".[71]
"Auroras are known to be generated by beams of electrons which are accelerated along Earth's magnetic field lines. The fast-moving electrons collide with atoms in the ionosphere at altitudes of between 100 to 600 km. This interaction with oxygen atoms results in a green or, more rarely, red glow in the night sky, while nitrogen atoms yield blue and purple colours."[72]
- "Type A aurora (green with red tops):
- colors due to emission by atomic oxygen
- Type D aurora (red):
- red color due to emission by atomic oxygen (as in Type A)
- Proton aurora:
- additional red and blue from atomic hydrogen emission"[73]
"This view [on the left] of the Aurora Australis, or Southern Lights, which was photographed by an astronaut aboard Space Shuttle Discovery (STS-39) in 1991, shows a spiked band of red and green aurora above the Earth's Limb. Calculated to be at altitudes ranging from 80 - 120 km (approx. 50-80 miles), the auroral light shown is due to the "excitation" of atomic oxygen in the upper atmosphere by charged particles (electrons) streaming down from the magnetosphere above."[74]
Moon
The Chandra X-ray Observatory has detected X-rays from oxygen, magnesium, aluminum and silicon atoms on the Moon.[75]
Mars
"The major atmospheric gases on Earth, Venus, and Mars were probably CO2, H2O, and N2. [The ions from the upper parts of an atmosphere] are often suprathermal, and their interactions can produce suprathermal neutral atoms as well [The] ionopause [...] separates the bound ionosphere from an outer region in which the solar wind is diverted and flows around and past the planet. This region still contains some neutral gas, and if such atoms are ionized by solar photons or electron impact, they are swept up in the flow."[76]
"There are strong reasons to believe that Mars once had much more atmospheric CO2 and H2O than it now has ... (Impacts, which may have eroded even larger amounts, operated at an earlier period.) ... The visible polar caps are thought to contain relatively small quantities. [...] More recently it has been proposed (35) that Mars may have had several episodes of high atmospheric pressure, warm conditions, and substantial precipitation of rain and snow, with a north polar ocean and southern glaciers."[76]
Methane is found in the Martian atmosphere, first image at right, by carefully observing the planet throughout several Mars years with NASA's Infrared Telescope Facility and the W.M. Keck telescope, both at Mauna Kea, Hawaii.
At right is an X-ray image of Mars. X-radiation from the Sun excites oxygen atoms in the Martian upper atmosphere, about 120 km above its surface, to emit X-ray fluorescence. A faint X-ray halo that extends out to 7,000 km above the surface of Mars has also been found.[77]
Europa
Europa has a tenuous atmosphere composed primarily of oxygen.
Observations with the Goddard High Resolution Spectrograph of the Hubble Space Telescope, first described in 1995, revealed that Europa has a tenuous atmosphere composed mostly of molecular oxygen (O2).[78][79] The surface pressure of Europa's atmosphere is 0.1 μPa, or 10−12 times that of the Earth.[80] In 1997, the Galileo spacecraft confirmed the presence of a tenuous ionosphere (an upper-atmospheric layer of charged particles) around Europa created by solar radiation and energetic particles from Jupiter's magnetosphere,[81][82] providing evidence of an atmosphere.
The molecular hydrogen that escapes Europa's gravity, along with atomic and molecular oxygen, forms a torus (ring) of gas in the vicinity of Europa's orbit around Jupiter. This "neutral cloud" has been detected by both the Cassini and Galileo spacecraft, and has a greater content (number of atoms and molecules) than the neutral cloud surrounding Jupiter's inner moon Io. Models predict that almost every atom or molecule in Europa's torus is eventually ionized, thus providing a source to Jupiter's magnetospheric plasma.[83]
Comets
One of the substances discovered in the tail by spectroscopic analysis was the toxic gas cyanogen.[84]
"In the green, the polarization of the pure silicate composition qualitatively appears a better fit to the shape of the observed polarization curves".[85] "[B]ut they are characterized by a high albedo."[85] The silicates used to model the cometary coma dust are olivene (Mg-rich is green) and the pyroxene, enstatite.[85]
Cyan blue is the color of several cyanide (CN) containing materials, including CN detected in comet haloes.
"Lulin's green color comes from the gases that make up its Jupiter-sized atmosphere. Jets spewing from the comet's nucleus contain cyanogen (CN: a poisonous gas found in many comets) and diatomic carbon (C2). Both substances glow green when illuminated by sunlight".[86]
For elongated dust particles in cometary comas an investigation is performed at 535.0 nm (green) and 627.4 nm (red) peak transmission wavelengths of the Rosetta spacecraft's OSIRIS Wide Angle Camera broadband green and red filters, respectively.[85] "In the green, the polarization of the pure silicate composition qualitatively appears a better fit to the shape of the observed polarization curves".[85] "[B]ut they are characterized by a high albedo."[85] The silicates used to model the cometary coma dust are olivene (Mg-rich is green) and the pyroxene, enstatite.[85]
"[U]nequivocal detections [occurred at McDonald Observatory on 10 nights from 25 June through 17 July 2000] of the O (1S) and O (1D) metastable lines in emission in the cometary [Comet C/1999 S4 (LINEAR)] spectrum. These lines are well separated from any telluric or cometary emission features."[87]
"[T]he presence of the [oxygen] green line can still be questioned, unless the 2972 Å trans-auroral line [1S - 3P] is detected (Herbig, 1976)."[88] "The transitions involved (allowed and forbidden) in the spectrum of the oxygen atoms in a cometary atmosphere" are 557.7 nm, 630.0 and 636.4 nm, 295.8 and 297.2 nm, 98.9 nm (a triplet), 799.0 nm, 844.7 nm, and 1304 nm (a triplet), 102.7 nm (a triplet) and 1128.7 nm.[88]
"When the green line is overwhelming (in faint comets like Encke), this emission is mainly due to the airglow, the red airglow emission being quenched and consequently weaker than the green."[88]
"The measured intensity on 10 January 1980, when the comet was 0.71 a.u. from the Sun and 0.615 a.u. from the Earth, is 30±15 Rayleighs.[88]
Heliospheres
The heliosphere is a bubble in space "blown" into the interstellar medium (the hydrogen and helium gas that permeates the galaxy) by the solar wind. Although electrically neutral atoms from interstellar volume can penetrate this bubble, virtually all of the material in the heliosphere emanates from the Sun itself.
Fermi glow
The Fermi glow are ultraviolet-glowing[89] particles, mostly hydrogen,[90] originating from the Solar System's Bow shock, created when light from stars and the Sun enter the region between the heliopause and the interstellar medium and undergo Fermi acceleration[90], bouncing around the transition area several times, gaining energy via collisions with atoms of the interstellar medium. The first evidence of the Fermi glow, and hence the bow shock, was obtained with the help from Voyager 1[89] and the Hubble Space Telescope[89].
Interstellar medium
"In 2009, NASA's Interstellar Boundary Explorer (IBEX) mission science team constructed the first-ever all-sky map [at right] of the interactions occurring at the edge of the solar system, where the sun's influence diminishes and interacts with the interstellar medium. A 2013 paper provides a new explanation for a giant ribbon of energetic neutral atoms – shown here in light green and blue -- streaming in from that boundary."[91]
"[T]he boundary at the edge of our heliosphere where material streaming out from the sun interacts with the galactic material ... emits no light and no conventional telescope can see it. However, particles from inside the solar system bounce off this boundary and neutral atoms from that collision stream inward. Those particles can be observed by instruments on NASA’s Interstellar Boundary Explorer (IBEX). Since those atoms act as fingerprints for the boundary from which they came, IBEX can map that boundary in a way never before done. In 2009, IBEX saw something in that map that no one could explain: a vast ribbon dancing across this boundary that produced many more energetic neutral atoms than the surrounding areas."[91]
""What we are learning with IBEX is that the interaction between the sun's magnetic fields and the galactic magnetic field is much more complicated than we previously thought," says Eric Christian, the mission scientist for IBEX at NASA's Goddard Space Flight Center in Greenbelt, Md. "By modifying an earlier model, this paper provides the best explanation so far for the ribbon IBEX is seeing.""[91]
H I regions
An H I region is an interstellar cloud composed of neutral atomic hydrogen (H I), in addition to the local abundance of helium and other elements.
SIMBAD contains some 6,010 entries of the astronomical object type 'HI' (H I region).
These regions are non-luminous, save for emission of the 21-cm (1,420 MHz) region spectral line. Mapping H I emissions with a radio telescope is a technique used for determining the structure of spiral galaxies.
The degree of ionization in an H I region is very small at around 10−4 (i.e. one particle in 10,000). The temperature of an H I region is about 100 K,[92] and it is usually considered as isothermal, except near an expanding H II region.[93]
For hydrogen, complete ionization "obviously reduces its cross section to zero, but ... the net effect of partial ionization of hydrogen on calculated absorption depends on whether or not observations of hydrogen [are] used to estimate the total gas. ... [A]t least 20 % of interstellar hydrogen at high galactic latitudes seems to be ionized".[94]
"When detection of neutral hydrogen (HI) absorption of the pulsar signal is possible, an estimate, or at least a limit on the distance may be obtained using a Galactic rotation model".[95]
"There is strong evidence for an elongated cavity in the neutral component of the [local insterstellar medium] LISM. This cavity surrounds the Sun and extends several hundred parsecs into quadrant 3 (Lucke 1978). The cavity appears as a region of low reddening extending 500 pc between ℓ = 210° and 255° and 1.5 kpc toward ℓ = 240°. Running counter to this is very heavy obscuration beyond ~100 pc in the first quadrant. Similarly, HI column densities derived from ultraviolet observations show a marked paucity in HI along LOSs directed towards ℓ = 230° (Frisch & York 1983; Paresce 1984). A similar morphology for this cavity is gleaned from NaI absorption measurements".[95]
"To further characterize the distribution of electrons in the LISM it is useful to relate their location to other interstellar features, such as bubbles, superbubbles, and clouds of neutral gas. There is strong evidence for an elongated cavity in the neutral component of the LISM. [...] There are several features of interest within this cavity. One of these is the local hot bubble (LHB): a volume encompassing the Sun distinguished by low neutral gas densities and a 106 K, soft X-ray emitting gas"[95]
The "neutral hydrogen column density [has] a level of N(HI)= 5 × 1019 cm−2"[95]
"Distance estimates now exist for a few hundreds of pulsars, resulting from three basic techniques: neutral hydrogen absorption (in combination with the Galactic rotation curve), trigonometric parallax and from associations with objects of known distance".[96]
Cold neutral mediums
H I regions of the ISM contain the cold neutral medium (CNM). The CNM constitutes 1-5 % by volume of the ISM, ranges in size from 100-300 pc, has a temperature between 50 and 100 K, with an atom density of 20-50 atoms/cm3.[97] The CNM has hydrogen in the neutral atomic state and emits the 21 cm line.
Warm neutral mediums
The warm neutral medium (WNM) is 10-20 % of the ISM, ranges in size from 300-400 pc, temperature between 6000 and 10000 K, is composed of neutral atomic hydrogen, has a density of 0.2-0.5 atoms/cm3, and emits the hydrogen 21 cm line.[97]
The "peak emissivity is enhanced by about 23% for the WIM [and only 11 % for the warm neutral medium (WNM)], although the peak frequency remains unchanged."[98]
Molecular clouds
G0.253+0.016 was probed "with another network of telescopes, the Combined Array for Research in Millimeter-wave Astronomy [CARMA] in California."[99]
"G0.253+0.016, which is about 30 light-years long, defies the conventional wisdom that dense gas glouds should produce lots of stars. ... The cloud is 25 times more dense than the famous Orion Nebula, which is birthing stars at a furious rate. But only a few stars are being born in G0.253+0.016, and they're pretty much all runts."[99]
"It's a very dense cloud and it doesn't form any massive stars, which is very weird"[99].
"CARMA data showed that gas within G0.253+0.016 is zipping around 10 times faster than gas in similar clouds. G0.253+0.016 is on the verge of flying apart, with its gas churning too violently to coalesce into stars. Further, the ... cloud is full of silicon monoxide, a compound typically produced when fast-moving gas smashes into dust particles. The abnormally large amounts of silicon monoxide suggest that G0.253+0.016 may actually consist of two colliding clouds, whose impact is generating powerful shockwaves."[99]
When surveyed at 1.1 mm as part of the Bolocam Galactic Plane Survey, "[t]he only currently known starless [massive proto-cluster] MPC is G0.253+0.016, which lies within the dense central molecular zone and is subject to greater environmental stresses than similar objects in the Galactic plane (Longmore et al. 2012)."[100]
Def. a "large and relatively dense cloud of cold gas and dust in interstellar space from which new stars are formed"[101] is called a molecular cloud.
The image on the right is a composite of visible (B 440 nm and V 557 nm) and near-infrared (768 nm) of the dark cloud (absorption cloud) Barnard 68.[102]
Barnard 68 is around 500 lyrs away in the constellation Ophiuchus.[102]
"At these wavelengths, the small cloud is completely opaque because of the obscuring effect of dust particles in its interior."[102]
"It was obtained with the 8.2-m VLT ANTU telescope and the multimode FORS1 instrument in March 1999."[102]
In the image at right is a molecular cloud of gas and dust that is being reduced. "Likely, within a few million years, the intense light from bright stars will have boiled it away completely. The cloud has broken off of part of the Carina Nebula, a star forming region about 8000 light years away. Newly formed stars are visible nearby, their images reddened by blue light being preferentially scattered by the pervasive dust. This image spans about two light years and was taken by the orbiting Hubble Space Telescope in 1999."[103]
A molecular cloud, sometimes called a stellar nursery if star formation is occurring within, is a type of interstellar cloud whose density and size permits the formation of molecules, most commonly molecular hydrogen (H2).
Molecular hydrogen is difficult to detect by infrared and radio observations, so the molecule most often used to determine the presence of H2 is CO (carbon monoxide). The ratio between CO luminosity and H2 mass is thought to be constant, although there are reasons to doubt this assumption in observations of some other galaxies.[104]
Such clouds make up < 1% of the ISM, have temperatures of 10-20 K and high densities of 102 - 106 atoms/cm3. These clouds are astronomical radio and infrared sources with radio and infrared molecular emission and absorption lines.
Messier 17
At right "is a near-infrared, colour-coded composite image of a sky field in the south-western part of the galactic star-forming region Messier 17. In this image, young and heavily obscured stars are recognized by their red colour. Bluer objects are either foreground stars or well-developed massive stars whose intense light ionizes the hydrogen in this region. The diffuse light that is visible nearly everywhere in the photo is due to emission from hydrogen atoms that have (re-)combined from protons and electrons. The dark areas are due to obscuration of the light from background objects by large amounts of dust — this effect also causes many of those stars to appear quite red. A cluster of young stars in the upper-left part of the photo, so deeply embedded in the nebula that it is invisible in optical light, is well visible in this infrared image. Technical information : The exposures were made through three filtres, J (at wavelength 1.25 µm; exposure time 5 min; here rendered as blue), H (1.65 µm; 5 min; green) and Ks (2.2 µm; 5 min; red); an additional 15 min was spent on separate sky frames. The seeing was 0.5 - 0.6 arcsec. The objects in the uppermost left corner area appear somewhat elongated because of a colour-dependent aberration introduced at the edge by the large-field optics. The sky field shown measures approx. 5 x 5 arcmin 2 (corresponding to about 3% of the full moon). North is up and East is left."[105]
Wolf-Rayet stars
"At the low density given by the spherically symmetric wind model (see Table 1), the dominant species in the gas are atomic ions while as the gas number density increases, the recombination of ions takes place and the gas composition is governed by neutral-phase chemistry, that is, the dominant species are neutral atoms and molecules although electrons and some ions are still present in relatively large amounts (for example, C+, O+ and He+)."[106]
Intergalactic medium
"Stephan's Quintet (SQ) is a system consisting of at least four interacting galaxies which is well known for its complex dynamical and star formation history. It possesses a rich intergalactic medium (IGM), where hydrogen clouds, both atomic and molecular, associated with two starbursts (refered to as SQ A and B) have been found."[107]
The composite image at right shows "Stephan’s Quintet [with] a diffuse arc of atomic hydrogen emission, indicated in green, roughly coincident with a shock front observed in the X-ray domain. Spitzer observations reveal powerful H2 emission originating from the center of this 103 km s-1 shock."[108]
"One of [SQs] most striking properties is that the major part of the gas is in the intragroup medium, most likely the result of interactions in the past and present. [...] a few times 108 yr ago the group experienced a collision with NGC 7320c, a galaxy ∼4 arcmin to the east of NGC 7319 but with a very similar recession velocity (6583 kms−1 [...] to the other galaxies in SQ. This collision removed most of the gas of NGC 7319 towards the west and east, and produced the eastern tidal tail which connects to NGC 7319. Presently, the group is experiencing another collision with the “intruder” galaxy NGC 7318b which strongly affects the interstellar medium (ISM) removed during the first collision."[107]
Spectroscopy
By comparing astronomical observations with laboratory measurements, astrochemists can infer the elemental abundances, chemical composition, and temperatures of stars and interstellar clouds. This is possible because ions, atoms, and molecules have characteristic spectra: that is, the absorption and emission of certain wavelengths (colors) of light, often not visible to the human eye. However, these measurements have limitations, with various types of radiation (radio, infrared, visible, ultraviolet etc.) able to detect only certain types of species, depending on the chemical properties of the molecules. Interstellar formaldehyde was the first polyatomic organic molecule detected in the interstellar medium.
Technology
"The sensors on the IBEX spacecraft are able to detect energetic neutral atoms (ENAs) at a variety of energy levels."[109]
The satellite's payload consists of two energetic neutral atom (ENA) imagers, IBEX-Hi and IBEX-Lo. Each of these sensors consists of a collimator that limits their fields-of-view, a conversion surface to convert neutral hydrogen and oxygen into ions, an electrostatic analyzer (ESA) to suppress ultraviolet light and to select ions of a specific energy range, and a detector to count particles and identify the type of each ion.
"IBEX–Lo can detect particles with energies ranging from 10 electron–volts to 2,000 electron–volts (0.01 keV to 2 keV) in 8 separate energy bands. IBEX–Hi can detect particles with energies ranging from 300 electron–volts to 6,000 electron–volts (.3 keV to 6 keV) in 6 separate energy bands. ... Looking across the entire sky, interactions occurring at the edge of our Solar System produce ENAs at different energy levels and in different amounts, depending on the process."[109]
“The Submillimeter Wave Astronomy Satellite (SWAS) [is in] low Earth orbit ... to make targeted observations of giant molecular clouds and dark cloud cores. The focus of SWAS is five spectral lines: water (H2O), isotopic water (H218O), isotopic carbon monoxide (13CO), molecular oxygen (O2), and neutral carbon (C I).”[110]
Acknowledgements
The content on this page was first contributed by: Henry A. Hoff.
Initial content for this page in some instances came from Wikiversity.
See also
References
- ↑ 1.0 1.1 1.2 David R. Williams (November 2011). Lunar Prospector Neutron Spectrometer (NS). Goddard Space Flight Laboratory: National Aeronautics and Space Administration. Retrieved 2012-01-11.
- ↑ EF Garman, GW Grime (2005). [www.sciencedirect.com/science/article/pii/S0079610704001257 "Elemental analysis of proteins by microPIXE"] Check
|url=value (help). Progress in biophysics and molecular biology. 89 (2): 173–205. doi:10.1016/j.pbiomolbio.2004.09.005. PMID 15910917. - ↑ Y. Osamura, H. Roberts, E. Herbst (2004). "On the possible interconversion between pairs of deuterated isotopomers of methanol, its ion, and its protonated ion in star-forming regions". Astronomy and Astrophysics. 421 (3): 1101–11. Retrieved 2014-01-23.
- ↑ "Hydrogen spectral series". San Francisco, California: Wikimedia Foundation, Inc. May 2, 2012. Retrieved 2012-05-14.
- ↑ The Hydrogen 21-cm Line, In: Hyperphysics. Georgia State University. 2004-10-30. Retrieved 2009-03-18.
- ↑ Richard L. Liboff (2002). Introductory Quantum Mechanics. Addison-Wesley. ISBN 0-8053-8714-5.
- ↑ Niels Bohr (1985), "Rydberg's discovery of the spectral laws", in J. Kalckar, N. Bohr: Collected Works, 10, Amsterdam: North-Holland Publ., pp. 373–9
- ↑ 8.0 8.1 "Balmer series". San Francisco, California: Wikimedia Foundation, Inc. February 2, 2012. Retrieved 2012-07-11.
- ↑ "Filters". Astro-Tom.com. Retrieved 2006-12-09.
- ↑ D. B. Murphy, K. R. Spring, M. J. Parry-Hill, I. D. Johnson, M. W. Davidson. "Interference Filters". Olympus. Retrieved 2006-12-09.
- ↑ "H-alpha". San Francisco, California: Wikimedia Foundation, Inc. December 30, 2011. Retrieved 2012-07-11.
- ↑ K. J. McCarthy, A. Baciero, B. Zurro, and TJ-II Team (12 June 2000). Impurity Behaviour Studies in the TJ-II Stellarator, In: 27th EPS Conference on Contr. Fusion and Plasma Phys. (PDF). 24B. Budapest: ECA. pp. 1244–7. Retrieved 2013-01-20.
- ↑ background radiation. San Francisco, California: Wikimedia Foundation, Inc. October 6, 2013. Retrieved 2014-04-10.
- ↑ 14.0 14.1 United Nations Scientific Committee on the Effects of Atomic Radiation (2008). Sources and effects of ionizing radiation. New York: United Nations. p. 4. ISBN 978-92-1-142274-0. Retrieved 9 November 2012.
- ↑ United Nations Scientific Committee on the Effects of Atomic Radiation (2006). Annex E: Sources-to-effects assessment for radon in homes and workplaces, In: Effects of Ionizing Radiation (PDF). II. New York: United Nations. ISBN 978-92-1-142263-4. Retrieved 2 December 2012.
- ↑ S. C. Diroff (April 2011). Radioactive human body — Harvard University Natural Science Lecture Demonstrations.
- ↑ http://www.ead.anl.gov/pub/doc/carbon14.pdf
- ↑ Isaac Asimov (1957). The Explosions Within Us, In: Only A Trillion (Revised and updated ed.). New York: ACE books. pp. 37–9. ISBN 1-157-09468-6.
- ↑ M. Amenomori, S. Ayabe, X. J. Bi, D. Chen, S. W. Cui, Danzengluobu, L. K. Ding, X. H. Ding, C. F. Feng, Zhaoyang Feng, Z. Y. Feng, X. Y. Gao, Q. X. Geng, H. W. Guo, H. H. He, M. He, K. Hibino, N. Hotta, HaibingHu, H. B. Hu, J. Huang, Q. Huang, H. Y. Jia, F. Kajino, K. Kasahara, Y. Katayose, C. Kato, K. Kawata, Labaciren, G. M. Le, A. F. Li, J. Y. Li, Y.-Q. Lou, H. Lu, S. L. Lu, X. R. Meng, K. Mizutani, J. Mu, K. Munakata, A. Nagai, H. Nanjo, M. Nishizawa, M. Ohnishi, I. Ohta, H. Onuma, T. Ouchi, S. Ozawa, J. R. Ren, T. Saito, T. Y. Saito, M. Sakata, T. K. Sako, T. Sasaki, M. Shibata, A. Shiomi, T. Shirai, H. Sugimoto, M. Takita, Y. H. Tan, N. Tateyama, S. Torii, H. Tsuchiya, S. Udo, B. S. Wang, H. Wang, X. Wang, Y. G. Wang, H. R. Wu, L. Xue, Y. Yamamoto, C. T. Yan, X. C. Yang, S. Yasue, Z. H. Ye, G. C. Yu, A. F. Yuan, T. Yuda, H. M. Zhang, J. L. Zhang, N. J. Zhang, X. Y. Zhang, Y. Zhang, Yi Zhang, Zhaxisangzhu, X. X. Zhou (2007). "Moon Shadow by Cosmic Rays under the Influence of Geomagnetic Field and Search for Antiprotons at Multi-TeV Energies" (PDF). Astroparticle Physics. 28 (1): 137–42. Retrieved 2012-08-22. Unknown parameter
|month=ignored (help) - ↑ J.J. Engelmann, P. Ferrando, A. Soutoul, P. Goret, E. Juliusson, L. Koch-Miramond, N. Lund, P. Masse, B. Peters, N. Petrou, and I.L. Rasmussen (1990). "Charge composition and energy spectra of cosmic-ray nuclei for elements from Be to Ni. Results from HEAO-3-C2". Astronomy and Astrophysics. 233 (1): 96–111. Bibcode:1990A&A...233...96E. Unknown parameter
|month=ignored (help);|access-date=requires|url=(help) - ↑ 21.0 21.1 21.2 Eric R. Christian (7 April 2011). Anomalous Cosmic Rays. Greenbelt, Maryland USA: NASA Goddard Space Flight Center. Retrieved 2017-08-05.
- ↑ SemperBlotto (12 November 2005). "protium". San Francisco, California: Wikimedia Foundation, Inc. Retrieved 2015-07-20.
- ↑ 23.0 23.1 23.2 "deuterium". San Francisco, California: Wikimedia Foundation, Inc. 16 July 2015. Retrieved 2015-07-20.
- ↑ "tritium". San Francisco, California: Wikimedia Foundation, Inc. 16 July 2015. Retrieved 2015-07-20.
- ↑ SemperBlotto (2 June 2012). "quadrium". San Francisco, California: Wikimedia Foundation, Inc. Retrieved 2015-07-20.
- ↑ G. Wallerstein, I. Iben Jr., P. Parker, A. M. Boesgaard, G. M. Hale, A. E. Champagne, C. A. Barnes, F. KM-dppeler, V. V. Smith, R. D. Hoffman, F. X. Timmes, C. Sneden, R. N. Boyd, B. S. Meyer, D. L. Lambert (1999). "Synthesis of the elements in stars: forty years of progress" (PDF). Reviews of Modern Physics. 69 (4): 995–1084. Bibcode:1997RvMP...69..995W. doi:10.1103/RevModPhys.69.995. Retrieved 2006-08-04.
- ↑ Walter K. Bonsack (1959). "The Abundance of Lithium and Convective Mixing in Stars of Type K". The Astrophysical Journal. 130 (11): 843–71. Bibcode:1959ApJ...130..843B. doi:10.1086/146777. Unknown parameter
|month=ignored (help);|access-date=requires|url=(help) - ↑ 28.0 28.1 M. D. Leising and D. D. Clayton (December 1, 1987). "Positron annihilation gamma rays from novae". The Astrophysical Journal. 323 (1): 159–69. Bibcode:1987ApJ...323..159L. doi:10.1086/165816. Retrieved 2014-02-01.
- ↑ Sbharris (16 May 2011). "Gamma ray". San Francisco, California: Wikimedia Foundation, Inc. Retrieved 6 July 2019.
- ↑ 30.0 30.1 30.2 30.3 30.4 30.5 Dschwen and CJeynes (27 July 2005). "Nuclear reaction analysis". San Francisco, California: Wikimedia Foundation, Inc. Retrieved 6 July 2019.
- ↑ Smith RK, Edgar RJ, Shafer RA (2002). "The X-ray halo of GX 13+1". Ap J. 581 (1): 562–69. arXiv:astro-ph/0204267. Bibcode:2002ApJ...581..562S. doi:10.1086/344151. Unknown parameter
|month=ignored (help) - ↑ 32.0 32.1 32.2 "Lyman series". San Francisco, California: Wikimedia Foundation, Inc. April 19, 2012. Retrieved 2012-06-26.
- ↑ John Brehm and William Mullin, Introduction to the Structure of Matter, John Wiley & Sons, Inc., 1989, p. 156 ISBN 0-471-60531-X
- ↑ C.-I. MengR. E. Huffman (1984). "Ultraviolet imaging from space of the aurora under full sunlight". Geophysical Research Letters. 11 (4): 315–8. doi:10.1029/GL011i004p00315. Retrieved 2013-05-31. Unknown parameter
|month=ignored (help) - ↑ 35.0 35.1 35.2 P. Sonnentrucker, D. A. Neufeld, T. G. Phillips, M. Gerin, D. C. Lis, M. De Luca, J. R. Goicoechea, J. H. Black, T. A. Bell, F. Boulanger, J. Cernicharo, A. Coutens, E. Dartois, M . Kaźmierczak, P. Encrenaz, E. Falgarone, T. R. Geballe, T. Giesen, B. Godard, P. F. Goldsmith, C. Gry, H. Gupta, P. Hennebelle, E. Herbst, P. Hily-Blant, C. Joblin, R. Kołos, J. Krełowski, J. Martín-Pintado, K. M. Menten, R. Monje, B. Mookerjea, J. Pearson, M. Perault, C. M. Persson, R. Plume, M. Salez, S. Schlemmer, M. Schmidt, J. Stutzki, D.Teyssier, C. Vastel, S. Yu, E. Caux, R. Güsten, W. A. Hatch, T. Klein, I. Mehdi, P. Morris and J. S. Ward (2010). "Detection of hydrogen fluoride absorption in diffuse molecular clouds with Herschel/HIFI: a ubiquitous tracer of molecular gas" (PDF). Astronomy & Astrophysics. 521: 5. doi:10.1051/0004-6361/201015082. Retrieved 2013-01-17. Unknown parameter
|month=ignored (help) - ↑ D. C. Lis, J. C. Pearson, D. A. Neufeld, P. Schilke, H. S. P. Müller,H. Gupta, T. A. Bell, C. Comito, T. G. Phillips, E. A. Bergin, C. Ceccarelli, P. F. Goldsmith, G. A. Blake, A. Bacmann, A. Baudry, M. Benedettini, A. Benz, J. Black, A. Boogert, S. Bottinelli, S. Cabrit, P. Caselli, A. Castets, E. Caux, J. Cernicharo, C. Codella, A. Coutens, N. Crimier, N. R. Crockett, F. Daniel, K. Demyk, C. Dominic, M.-L. Dubernet, M. Emprechtinger, P. Encrenaz, E. Falgarone, A. Fuente, M. Gerin, T. F. Giesen, J. R. Goicoechea, F. Helmich, P. Hennebelle, Th. Henning, E. Herbst, P. Hily-Blant, Å. Hjalmarson, D. Hollenbach, T. Jack, C. Joblin, D. Johnstone, C. Kahane, M. Kama, M. Kaufman, A. Klotz, W. D. Langer, B. Larsson, J. Le Bourlot, B. Lefloch, F. Le Petit, D. Li, R. Liseau, S. D. Lord, A. Lorenzani, S. Maret, P. G. Martin, G. J. Melnick, K. M. Menten, P. Morris, J. A. Murphy, Z. Nagy, B. Nisini, V. Ossenkopf, S. Pacheco, L. Pagani, B. Parise, M. Pérault, R. Plume, S.-L. Qin, E. Roueff, M. Salez, A. Sandqvist, P. Saraceno, S. Schlemmer, K. Schuster, R. Snell, J. Stutzki, A. Tielens, N. Trappe, F. F. S. van der Tak, M. H. D. van der Wiel, E. van Dishoeck, C. Vastel, S. Viti, V. Wakelam, A. Walters, S. Wang, F. Wyrowski, H. W. Yorke, S. Yu, J. Zmuidzinas, Y. Delorme, J.-P. Desbat, R. Güsten, J.-M. Krieg, and B. Delforge (2010). "Herschel/HIFI discovery of interstellar chloronium (H2Cl+)" (PDF). Astronomy & Astrophysics. 521: 5. doi:10.1051/0004-6361/201014959. Retrieved 2013-01-18. Unknown parameter
|month=ignored (help) - ↑ 37.0 37.1 Lewis E. Snyder, David Buhl, B. Zuckerman, Patrick Palmer (1969). "Microwave detection of interstellar formaldehyde". Physical Review Letters. 22 (13): 679–81. doi:10.1103/PhysRevLett.22.679. Retrieved 2011-12-17. Unknown parameter
|month=ignored (help) - ↑ http://www.cfa.harvard.edu/mmw/CO_survey_aitoff.jpg.
- ↑ Kuan YJ, Charnley SB, Huang HC; et al. (2003). "Interstellar glycine". The Astrophysical Journal. 593 (2): 848–867. Bibcode:2003ApJ...593..848K. doi:10.1086/375637.
- ↑ Snyder LE, Lovas FJ, Hollis JM; et al. (2005). "A rigorous attempt to verify interstellar glycine". The Astrophysical Journal. 619 (2): 914–30. arXiv:astro-ph/0410335. Bibcode:2005ApJ...619..914S. doi:10.1086/426677.
- ↑ 41.0 41.1 Mike Gruntman. Charge Exchange Diagrams. Energetic Neutral Atoms Tutorial. Retrieved 2009-10-27.
- ↑ 42.0 42.1 K. C. Hsieh and C. C. Curtis (1998). "Imaging Space Plasma With Energetic Neutral Atoms Without Ionization, In: Measurement Techniques in Space Plasmas: Fields" (PDF). Geophysical Monograph 103. American Geophysical Union: 235–49. Retrieved 2014-10-02.
- ↑ CK Birdsall, A. Bruce Langdon (October 1, 2004). Plasma Physics via Computer Simulation. New York: CRC Press. p. 479. ISBN 0-7503-1035-1 Check
|isbn=value: checksum (help). Retrieved 2011-12-17. - ↑ "hydrogen". San Francisco, California: Wikimedia Foundation, Inc. September 1, 2013. Retrieved 2013-10-05.
- ↑ T. N. Gautier II and Uwe Fink, Richard R. Treffers, and Harold P. Larson (1976). "Detection of Molecular Hydrogen Quadrupole Emission in the Orion Nebula". The Astrophysical Journal. 207 (07): L129–33. Bibcode:1976ApJ...207L.129G. doi:10.1086/182195. Retrieved 2013-10-05. Unknown parameter
|month=ignored (help) - ↑ 46.0 46.1 Oura, K.; Lifshits, V.G.; Saranin, A.A.; Zotov, A.V.; et al. (2003). Surface Science: An Introduction. Springer-Verlag. ISBN 3-540-00545-5.
- ↑ Oura et al. (2003) p. 136
- ↑ Oura et al. (2003) p. 114
- ↑ Oura et al. (2003) p. 117
- ↑ Whitham D. Reeve (1973). Book Review (PDF). Anchorage, Alaska USA: Whitham D. Reeve. Retrieved 2014-01-11.
- ↑ I. Dzyaloshinskii (May 1992). "Effects of the finite proton mass in a hydrogen atom in crossed magnetic and electric fields: a state with a giant electric dipole moment". Physics Letters A. 165 (1): 69–71. Bibcode:1992PhLA..165...69D. doi:10.1016/0375-9601(92)91056-W. Retrieved 2014-02-13.
- ↑ E. Quémerais (30 June 2003). SOHO Fact Sheet (PDF). Greenbelt, MD 20771, USA: NASA/GSFC. Retrieved 2016-03-27.
- ↑ R. M. Silverstein, G. C. Bassler and T. C. Morrill, Spectrometric Identification of Organic Compounds, 5th Ed., Wiley, 1991.
- ↑ 54.0 54.1 M. A. Livshits (1997). "The Amount of Lithium Produced during Impulsive Flares". Solar Physics. 173 (2): 377–81. doi:10.1023/A:1004958522216. Retrieved 2014-10-01. Unknown parameter
|month=ignored (help) - ↑ Jörg R. Hoerandel (2003). "On the knee in the energy spectrum of cosmic rays". Astroparticle Physics. 19 (2): 193–220. doi:10.1016/S0927-6505(02)00198-6. Retrieved 2017-08-07. Unknown parameter
|month=ignored (help) - ↑ A Dictionary of Units of Measurement
- ↑ John C. Martin. New Analysis RR Lyrae Kinematics in the Solar Neighborhood, In: What we learn from a star's metal content. Retrieved September 7, 2005.
- ↑ E.G. Gibson (1973). The Quiet Sun. NASA. ASIN B0006C7RS0.
- ↑ Shu, F.H. (1991). The Physics of Astrophysics. 1. University Science Books. ISBN 0-935702-64-4.
- ↑ T. Guillot, A. Burrows, W. B. Hubbard, J. I. Lunine and D. Saumon (1996). "Giant Planets at Small Orbital Distances". The Astrophysical Journal. 459 (3): L35–8. arXiv:astro-ph/9511109. Bibcode:1996ApJ...459L..35G. doi:10.1086/309935. Retrieved 2012-02-09. Unknown parameter
|month=ignored (help) - ↑ H. N. Russell (1929). The Astrophysical Journal. 70: 11–82. Missing or empty
|title=(help);|access-date=requires|url=(help) - ↑ Sarbani Basu and H. M. Antia (2008). "Helioseismology and Solar Abundances". Physics Reports. 457 (5–6): 217–83. arXiv:0711.4590. Bibcode:2008PhR...457..217B. doi:10.1016/j.physrep.2007.12.002. Unknown parameter
|month=ignored (help);|access-date=requires|url=(help) - ↑ Paul A. Tipler, Gene Mosca (May 1, 2007). Physics for Scientists and Engineers. Macmillan. p. 1172. ISBN 142920124X. Retrieved 2014-01-02.
- ↑ K. Dennerl (November 29, 2001). Venus: Venus in a New Light. Boston, Massachusetts, USA: Harvard University, NASA. Retrieved 2012-11-26.
- ↑ E. C. Roelof, D. G. Mitchell, D. J. Williams (1985). "Energetic neutral atoms (E ∼ 50 keV) from the ring current: IMP 7/8 and ISEE 1". Journal of Geophysical Research. 90 (A11): 10, 991–11, 008. doi:10.1029/JA090iA11p10991. Retrieved 2012-08-12.
- ↑ D. G. Mitchell, K. C. Hsieh, C. C. Curtis, D. C. Hamilton, H. D. Voes, E. C, Roelof, P. C:son-Brandt (2001). "Imaging two geomagnetic storms in energetic neutral atoms". Geophysical Research Letters. 28 (6): 1151–4. doi:10.1029/2000GL012395. Retrieved 2012-08-12.
- ↑ Dan Burbank (December 21, 2011). Love and Joy for the New Year. International Space Station: NASA's Earth Observatory. Retrieved 2012-07-22.
- ↑ European Space Agency (9 April 2015). Aurora over Icelandic Lake. ESA. Retrieved 2015-04-12.
- ↑ Marilia Samara (7 October 2015). Unexpected role of electrons in creating pulsating auroras. Greenbelt, Maryland USA: NASA/Goddard Space Flight Center. Retrieved 2015-12-01.
- ↑ Sarah Frazier (30 November 2015). NASA Plans Twin Sounding Rocket Launches over Norway this Winter. Washington, DC USA: NASA. Retrieved 2015-11-30.
- ↑ A. Bhardwaj & R. Elsner (February 20, 2009). Earth Aurora: Chandra Looks Back At Earth. 60 Garden Street, Cambridge, MA 02138 USA: Harvard-Smithsonian Center for Astrophysics. Retrieved 2013-05-10.
- ↑ Andrew Wright (9 April 2015). Heart of the Black Auroras Revealed by Cluster. European Space Agency. Retrieved 2015-04-12.
- ↑ rgk (July 2012). AURORA [POLARIS]. Albany, New York USA: University of New York at Albany. Retrieved 2015-12-02.
- ↑ Rob Gutro (4 April 2005). Earth's Auroras Don't Mirror. Washington, DC USA: NASA. Retrieved 2015-11-27.
- ↑ Robert Burnham (2004). Moon Prospecting. Kalmbach Publishing Co.
|access-date=requires|url=(help) - ↑ 76.0 76.1 Donald M. Hunten (February 12, 1993). "Atmospheric Evolution of the Terrestrial Planets" (PDF). Science. 259 (5097): 915–20. Retrieved 2014-09-21.
- ↑ K. Dennerl (2002). "Discovery of X-rays from Mars with Chandra". Astronomy & Astrophysics. 394 (11): 1119–28. Bibcode:2002A&A...394.1119D. doi:10.1051/0004-6361:20021116. Unknown parameter
|month=ignored (help);|access-date=requires|url=(help) - ↑ Hall, Doyle T.; et al.; Detection of an oxygen atmosphere on Jupiter's moon Europa, Nature, Vol. 373 (23 February 1995), pp. 677–679 (accessed 15 April 2006)
- ↑ Donald Savage, Tammy Jones, and Ray Villard (1995-02-23). Hubble Finds Oxygen Atmosphere on Europa, In: Project Galileo. NASA, Jet Propulsion Laboratory. Retrieved 2007-08-17.
- ↑ McGrath (2009). "Atmosphere of Europa". In Pappalardo, Robert T.; McKinnon, William B.; and Khurana, Krishan K. Europa. University of Arizona Press. ISBN 0-8165-2844-6.
- ↑ Arvydas J. Kliore, D. P. Hinson, F. Michael Flasar, Andrew F. Nagy, Thomas E. Cravens (1997). "The Ionosphere of Europa from Galileo Radio Occultations". Science. 277 (5324): 355–8. Bibcode:1997Sci...277..355K. doi:10.1126/science.277.5324.355. PMID 9219689. Retrieved 2007-08-10. Unknown parameter
|month=ignored (help) - ↑ Galileo Spacecraft Finds Europa has Atmosphere, In: Project Galileo. NASA, Jet Propulsion Laboratory. July 1997. Retrieved 2007-08-10.
- ↑ William H. Smyth, Max L. Marconi (2006). "Europa's atmosphere, gas tori, and magnetospheric implications". Icarus. 181 (2): 510. Bibcode:2006Icar..181..510S. doi:10.1016/j.icarus.2005.10.019.
- ↑ Yerkes Observatory Finds Cyanogen in Spectrum of Halley's Comet. 8 February 1910. Retrieved 15 November 2009.
- ↑ 85.0 85.1 85.2 85.3 85.4 85.5 85.6 I. Bertini, N. Thomas, and C. Barbieri (2007). "Modeling of the light scattering properties of cometary dust using fractal aggregates". Astronomy & Astrophysics. 461 (1): 351–64. Bibcode:2007A&A...461..351B. doi:10.1051/0004-6361:20065461. Retrieved 2011-12-08. Unknown parameter
|month=ignored (help); Unknown parameter|pdf=ignored (help) - ↑ James A. Phillips (2009). Green Comet Approaches Earth. National Aeronautics and Space Administration Science News. Retrieved 2012-05-05.
- ↑ Anita L. Cochran, William D. Cochran (2001). "Observations of O (1S) and O (1D) in Spectra of C/1999 S4 (LINEAR)" (PDF). Icarus. 154 (2): 381–90. arXiv:astro-ph/0108065. Bibcode:2001Icar..154..381C. doi:10.1006/icar.2001.6718. Retrieved 2013-01-16. Unknown parameter
|month=ignored (help) - ↑ 88.0 88.1 88.2 88.3 M. C. Festou and P. D. Feldman (1981). "The Forbidden Oxygen Lines in Comets". Astronomy & Astrophysics. 103 (1): 154–9. Bibcode:1981A&A...103..154F. Unknown parameter
|month=ignored (help);|access-date=requires|url=(help) - ↑ 89.0 89.1 89.2 "The Heliosphere is Tilted - implications for the 'Galactic Weather Forecast'?". Hubble. 13 March 2000.
- ↑ 90.0 90.1 "Where the Solar Wind Hits the Wall". BRIC. 20 March 2000.
- ↑ 91.0 91.1 91.2 Karen C. Fox (February 5, 2013). A Major Step Forward in Explaining the Ribbon in Space Discovered by NASA’s IBEX Mission. Greenbelt, MD USA: NASA's Goddard Space Flight Center. Retrieved 2013-02-06.
- ↑ L. Spitzer, M. P. Savedoff (1950). "The Temperature of Interstellar Matter. III". The Astrophysical Journal. 111: 593. Bibcode:1950ApJ...111..593S. doi:10.1086/145303.
- ↑ Savedoff MP, Greene J (November 1955). "Expanding H II region". Astrophysical Journal. 122 (11): 477–87. Bibcode:1955ApJ...122..477S. doi:10.1086/146109.
- ↑ Robert Morrison and Dan McCammon (July 1983). "Interstellar photoelectric absorption cross sections, 0.03-10 keV". The Astrophysical Journal. 270 (7): 119–22. Bibcode:1983ApJ...270..119M.
|access-date=requires|url=(help) - ↑ 95.0 95.1 95.2 95.3 M. Toscano, M. C. Britton, R. N. Manchester, M. Bailes, J. S. Sandhu, S. R. Kulkarni, S. B. Anderson (October 1, 1999). "Parallax of PSR J1744–1134 and the local interstellar medium". The Astrophysical Journal. 523 (2): L171. doi:10.1086/312276. Retrieved 2014-04-19.
- ↑ R. Stepanov, P. Frick, A. Shukurov and D. Sokoloff (August 2002). "Wavelet tomography of the Galactic magnetic field I. The method". Astronomy & Astrophysics. 391 (08): 361–8. arXiv:astro-ph/0112507. Bibcode:2002A&A...391..361S. doi:10.1051/0004-6361:20020552. Retrieved 2014-04-20.
- ↑ 97.0 97.1 K. Ferriere (2001). "The Interstellar Environment of our Galaxy". Reviews of Modern Physics. 73 (4): 1031–66. arXiv:astro-ph/0106359. Bibcode:2001RvMP...73.1031F. doi:10.1103/RevModPhys.73.1031.
- ↑ Yacine Ali-Haïmoud (2013). "Spinning dust radiation: a review of the theory" (PDF). Advances in Astronomy. 2013 (462697). arXiv:1211.2748. Bibcode:2013AdAst2013E...2A. doi:10.1155/2013/462697. Retrieved 2014-10-19.
- ↑ 99.0 99.1 99.2 99.3 SPACE.com Staff (January 14, 2013). Baffling Star Birth Mystery Finally Solved. Yahoo! Inc. Retrieved 2013-01-15.
- ↑ A. Ginsburg, E. Bressert, J. Bally, C. Battersby (2012). "There are No Starless Massive Proto-Clusters in the First Quadrant of the Galaxy" (PDF). The Astrophysical Journal Letters. 758 (2): L29–33. arXiv:1208.4097. Bibcode:2012ApJ...758L..29G. doi:10.1088/2041-8205/758/2/L29. Retrieved 2013-01-15. Unknown parameter
|month=ignored (help) - ↑ SemperBlotto (20 April 2006). molecular cloud. San Francisco, California: Wikimedia Foundation, Inc. Retrieved 2015-09-30.
- ↑ 102.0 102.1 102.2 102.3 eso0102 (10 January 2001). How to Become a Star. European Southern Observatory. Retrieved 2015-09-30.
- ↑ Robert Nemiroff (MTU) & Jerry Bonnell (USRA) (June 30, 2003). Disappearing Clouds in Carina. Goddard Space Flight Center, Greenbelt, Maryland, USA: NASA. Retrieved 2012-09-05.
- ↑ Craig Kulesa. Overview: Molecular Astrophysics and Star Formation. Retrieved September 7, 2005.
- ↑ ESO00 (September 14, 2000). Peering into a Star Factory. Paranal: European Southern Observatory. Retrieved 2013-03-14.
- ↑ I. Cherchneff, Y.H. Le Teuff, P.M. Williams, and A.G.G.M. Tielens (May 2000). "Dust formation in carbon-rich Wolf-Rayet stars. I. Chemistry of small carbon clusters and silicon species". Astronomy and Astrophysics. 357 (5): 572–80. Bibcode:2000A&A...357..572C. Retrieved 2011-12-05.
- ↑ 107.0 107.1 Ute Lisenfeld, Jonathan Braine, Pierre-Alain Duc, Stéphane Leon, Vassilis Charmandaris, and Elias Brinks (2002). "Abundant molecular gas in the intergalactic medium of Stephan's Quintet". Astronomy and Astrophysics. 394 (11): 823–33. arXiv:astro-ph/0208494. Bibcode:2002A&A...394..823L. doi:10.1051/0004-6361:20021232. Retrieved 2014-02-11.
- ↑ Martin Harwit, George Helou, Lee Armus, C. Matt Bradford, Paul F. Goldsmith, Michael Hauser, David Leisawitz, Daniel F. Lester, George Rieke, and Stephen A. Rinehart (2010). "Far-Infrared/Submillimeter Astronomy from Space Tracking an Evolving Universe and the Emergence of Life" (PDF). Greenbelt, Maryland USA: NASA Goddard Space Flight Center: 39. Retrieved 2014-02-10.
- ↑ 109.0 109.1 Dave McComas and Lindsay Bartolone (May 10, 2012). IBEX: Interstellar Boundary Explorer. San Antonio, Texas USA: NASA Southwest Research Institute. Retrieved 2012-08-11.
- ↑ "Submillimetre astronomy". Wikipedia. San Francisco, California: Wikimedia Foundation, Inc. June 2, 2012. Retrieved 2012-06-08.
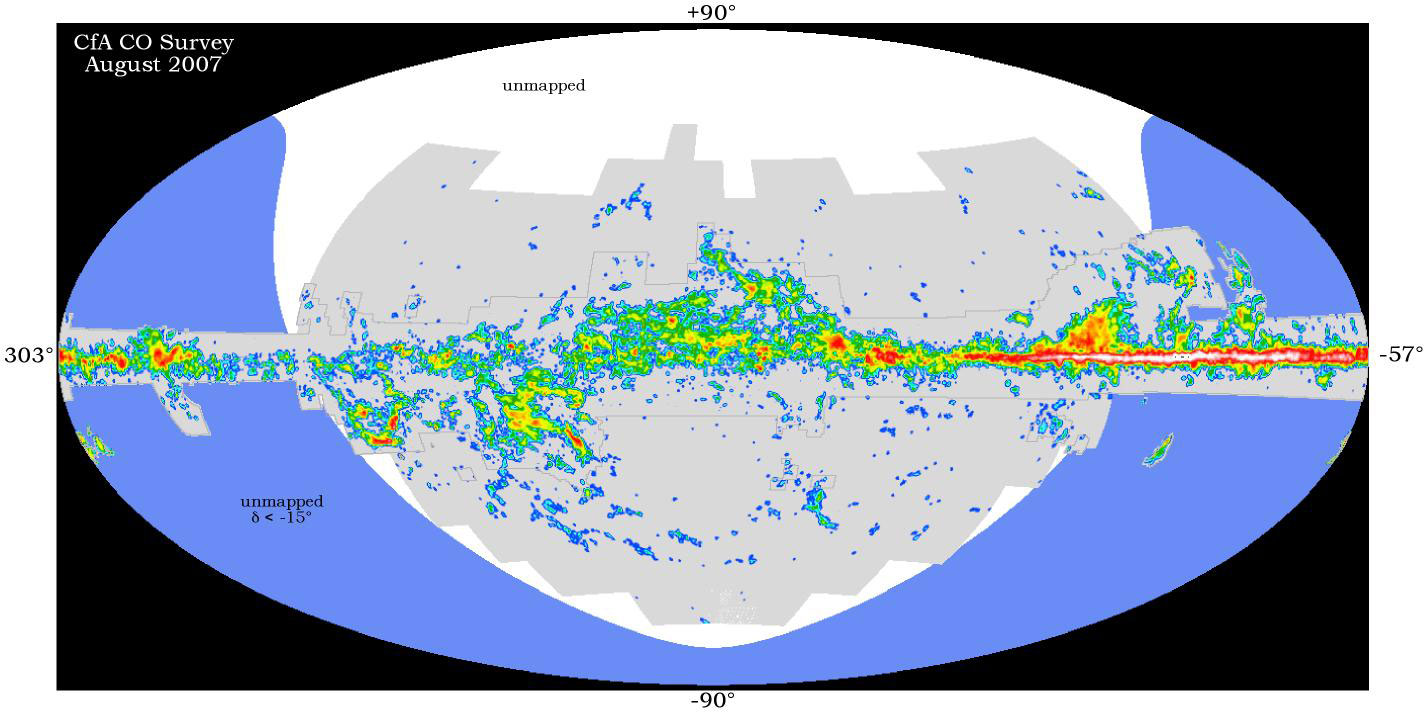
External links
Editor-In-Chief: Henry A Hoff
- Pages with URL errors
- CS1 maint: Multiple names: authors list
- Pages with citations using unsupported parameters
- Pages using citations with accessdate and no URL
- CS1 maint: Explicit use of et al.
- CS1 errors: ISBN
- Pages with citations lacking titles
- CS1 maint: Multiple names: editors list
- CS1: Julian–Gregorian uncertainty
- Pages with broken file links
- Radiation astronomy/Lectures
- Resources last modified in October 2019