Right bundle branch block EKG examples: Difference between revisions
No edit summary |
No edit summary |
||
| Line 7: | Line 7: | ||
[[Image:Right bundle branch block.jpg|center|800px]] | [[Image:Right bundle branch block.jpg|center|800px]] | ||
---- | ---- | ||
EKG below is a recording from an older man in the [[surgical intensive care unit]]. He was recovering from a [[motor vehicle accident]] where he sustained a [[chest injury]] from his seat belt. The rhythm is [[sinus rhythm]] with a prolonged p wave duration in lead III( >140ms) and a pronounced terminal negativity in V1 suggestive of left atrial abnormality. The [[QRS]] is wide with a duration of 137ms and a superior and right ward axis. There is an [[RSR]] in V1 and the S wave is greater than the R in V6. This is an unusual pattern for aberrance and is more in keeping with ventricular ectopy. In this case, this appears to be a [[right bundle branch block]] with a possible left posterior hemi-block. | EKG below is a recording from an older man in the [[surgical intensive care unit]]. He was recovering from a [[motor vehicle accident]] where he sustained a [[chest injury]] from his seat belt. The rhythm is [[sinus rhythm]] with a prolonged p wave duration in lead III( >140ms) and a pronounced terminal negativity in V1 suggestive of left atrial abnormality. The [[QRS]] is wide with a duration of 137ms and a superior and right ward axis. There is an [[RSR]] in V1 and the S wave is greater than the R in V6. This is an unusual pattern for aberrance and is more in keeping with ventricular ectopy. In this case, this appears to be a [[right bundle branch block]] with a possible left posterior hemi-block. | ||
| Line 119: | Line 120: | ||
[[File: Right bundle branch block 24.jpg|center|800px]] | [[File: Right bundle branch block 24.jpg|center|800px]] | ||
---- | ---- | ||
The cardiogram below shows sinus rhythm with a normal [[PR interval]] and a prolonged QRS interval (>120ms). There is a conduction abnormality best described as a right bundle branch block due to the rsR' wave in V1. Note the S wave in V6 which is due to the RBBB is smaller than the R wave in V6. The axis of the QRS is difficult to determine, but one usually looks at the first 60 ms. (1 1/2 small squares) to determine the axis with a RBBB. If the axis of the first 60 ms. of the QRS is more than 90 degrees and there is an rS in lead I and a Q in lead III then on would consider a left [[posterior fasicular block]]. This is not the case here. | The cardiogram below shows sinus rhythm with a normal [[PR interval]] and a prolonged QRS interval (>120ms). There is a conduction abnormality best described as a right bundle branch block due to the rsR' wave in V1. Note the S wave in V6 which is due to the RBBB is smaller than the R wave in V6. The axis of the QRS is difficult to determine, but one usually looks at the first 60 ms. (1 1/2 small squares) to determine the axis with a RBBB. If the axis of the first 60 ms. of the QRS is more than 90 degrees and there is an rS in lead I and a Q in lead III then on would consider a left [[posterior fasicular block]]. This is not the case here. | ||
[[File:Right bundle branch block 25.jpg|center|800px]] | [[File:Right bundle branch block 25.jpg|center|800px]] | ||
---- | ---- | ||
Below is an electrocardiogram of patient with [[RBBB]] | |||
[[File:Right bundle branch block 26.jpg|center|800px]] | |||
==Sources== | ==Sources== | ||
Copyleft images obtained courtesy of ECGpedia, http://en.ecgpedia.org/index.php?title=Special:NewFiles&offset=&limit=500. | Copyleft images obtained courtesy of ECGpedia, http://en.ecgpedia.org/index.php?title=Special:NewFiles&offset=&limit=500. | ||
Revision as of 20:07, 16 October 2012
Editor-In-Chief: C. Michael Gibson, M.S., M.D. [1]
For the main page on right bundle branch block, click here.
EKG examples
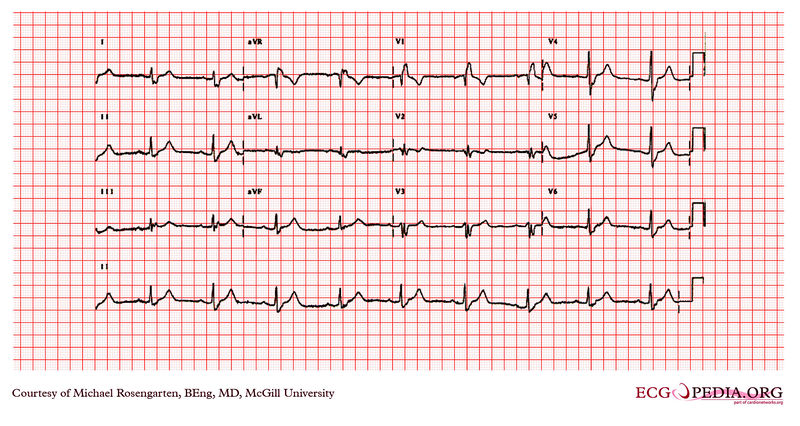
EKG below is from an elderly woman who had previously undergone surgery for recurrent ventricular tachycardia. She was being treated with Tambacor and metoprolol. The cardiogram shows sinus rhythm with a wide QRS of 159ms consistent with a RBBB and a rightward axis suggesting right posterior hemi-block. The PR interval is slightly prolonged at 2121ms. The poor R wave progression seen best in lead V2 suggests previous anterior wall MI.
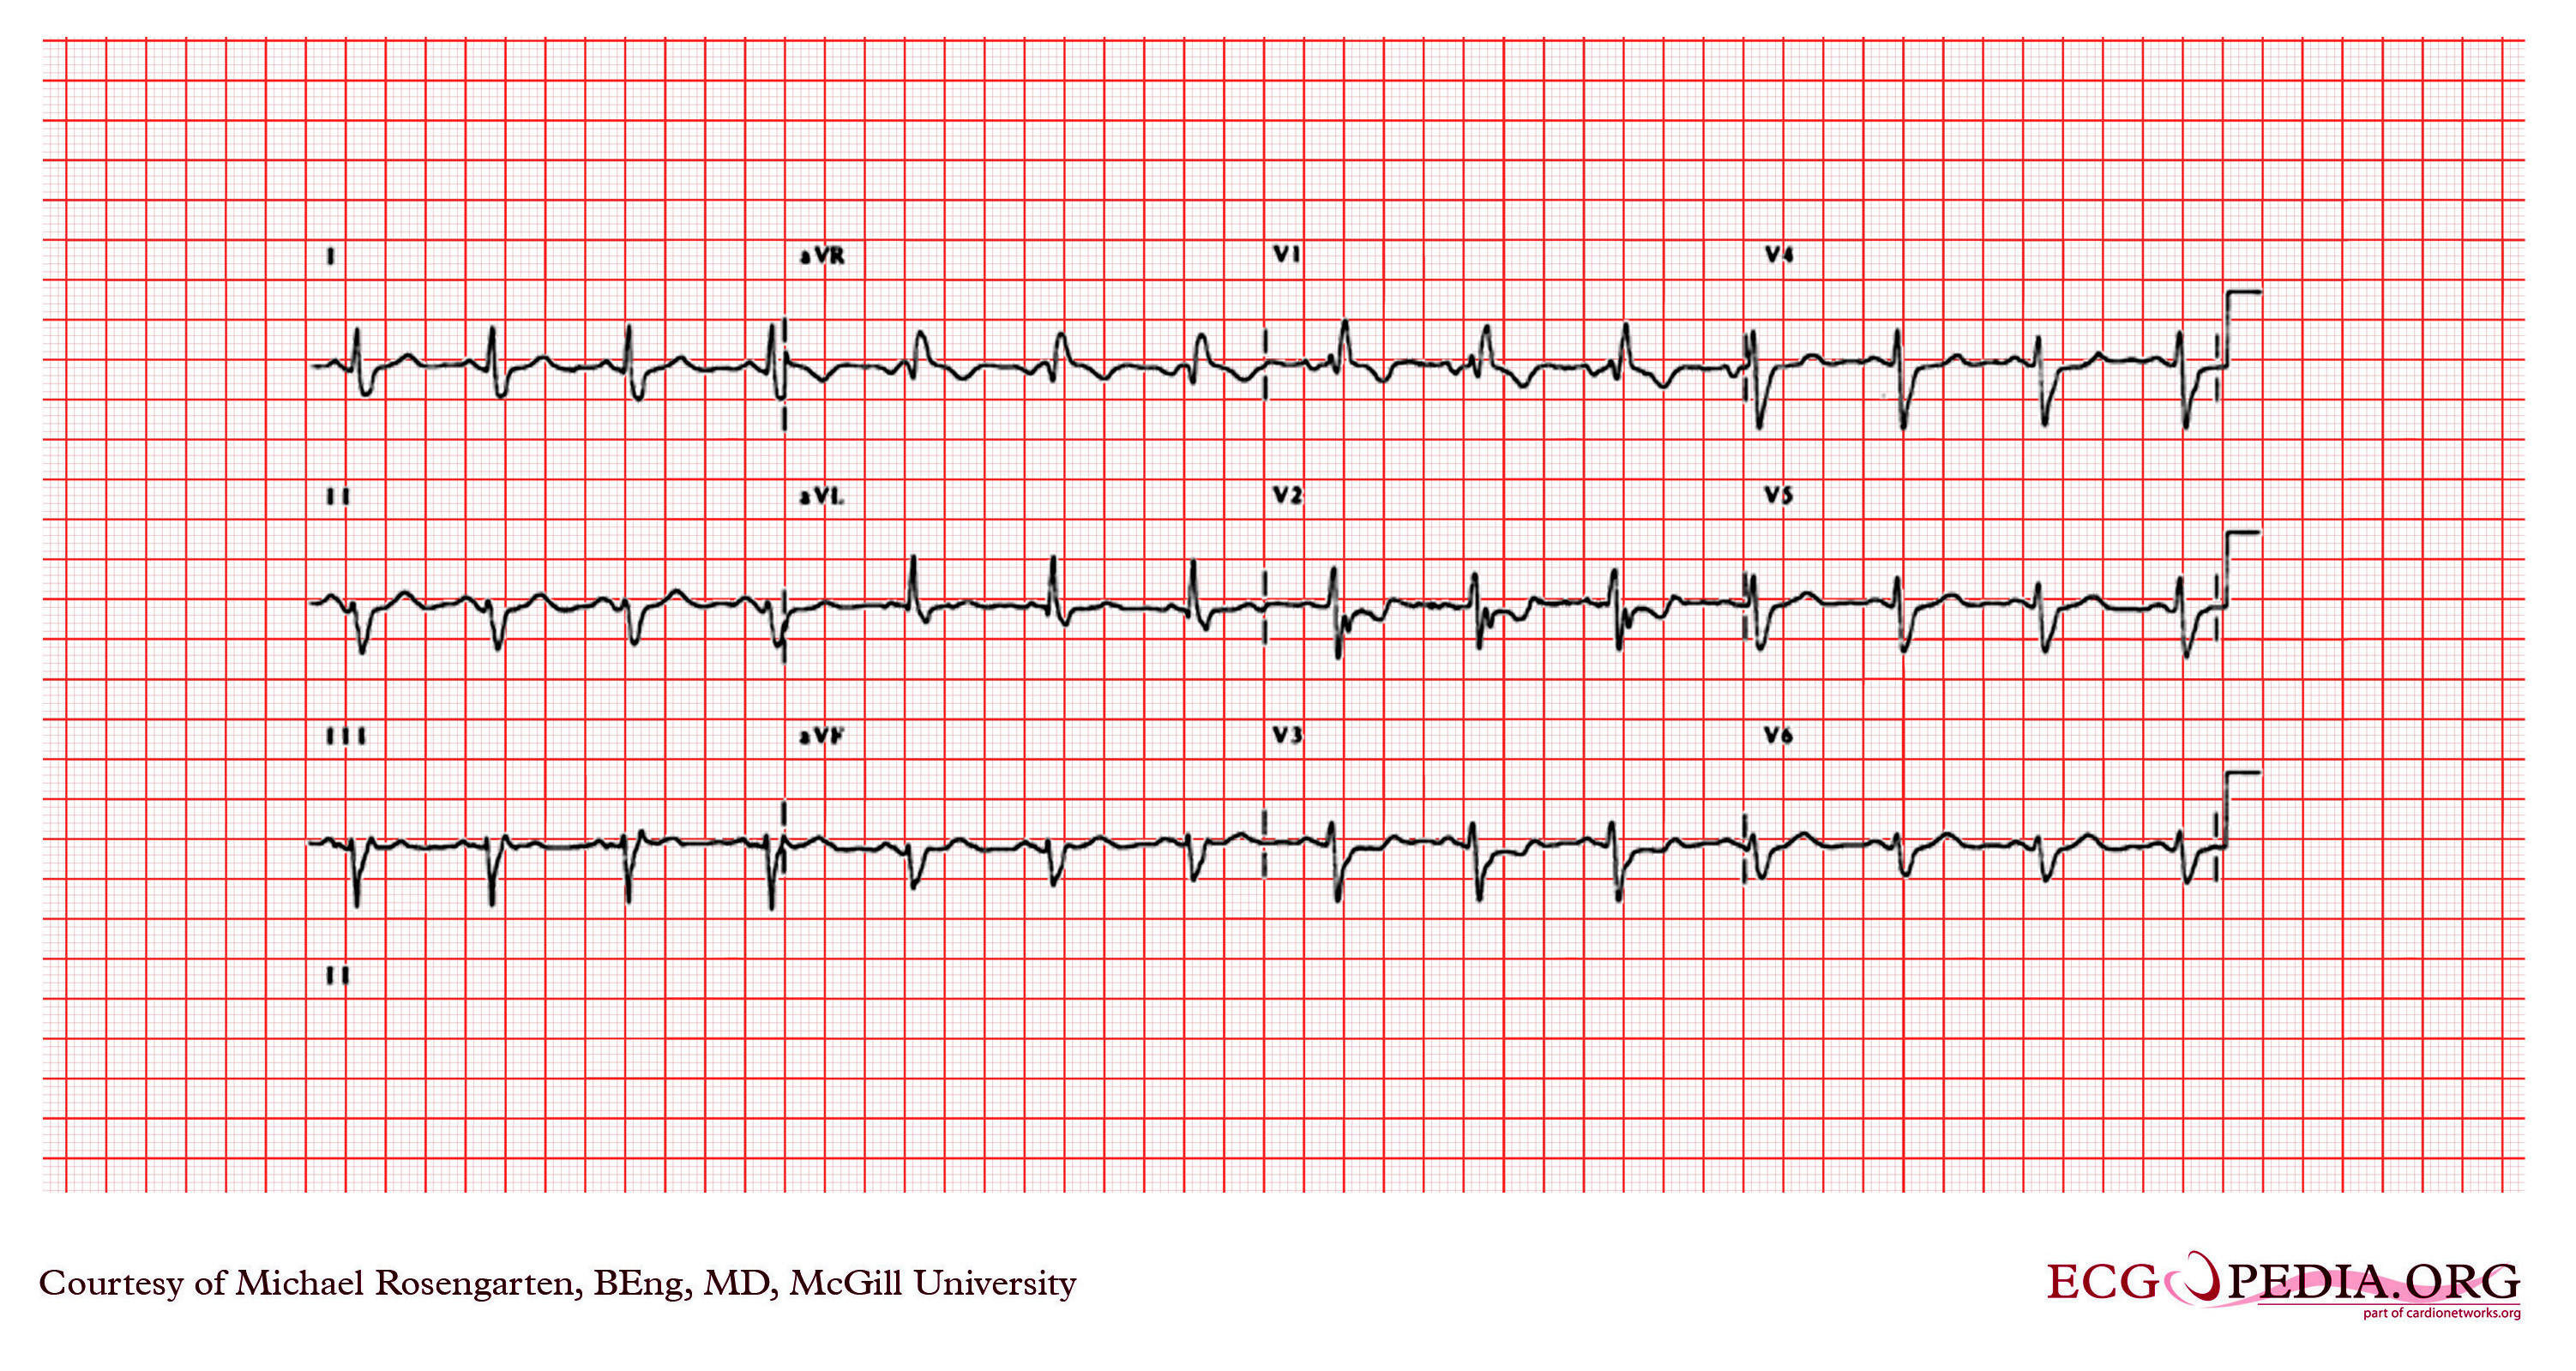
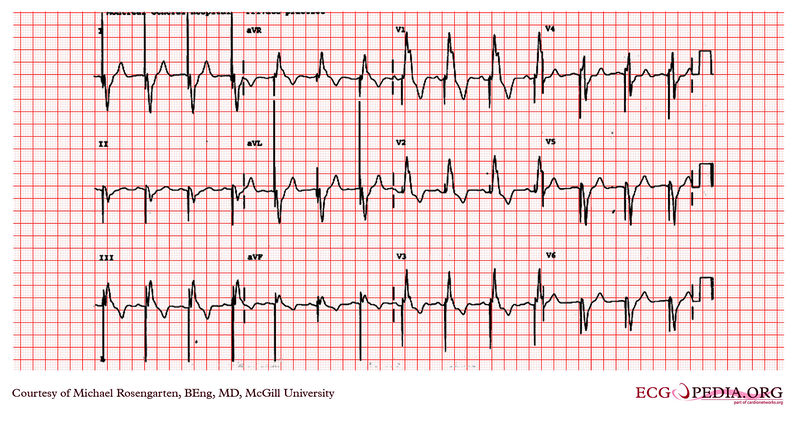
EKG below is a recording from an older man in the surgical intensive care unit. He was recovering from a motor vehicle accident where he sustained a chest injury from his seat belt. The rhythm is sinus rhythm with a prolonged p wave duration in lead III( >140ms) and a pronounced terminal negativity in V1 suggestive of left atrial abnormality. The QRS is wide with a duration of 137ms and a superior and right ward axis. There is an RSR in V1 and the S wave is greater than the R in V6. This is an unusual pattern for aberrance and is more in keeping with ventricular ectopy. In this case, this appears to be a right bundle branch block with a possible left posterior hemi-block.
Of note, in spite of this conduction disturbance the patient was able to sustain reentrant supraventricular tachycaridas requiring intravenous adenosine for termination.
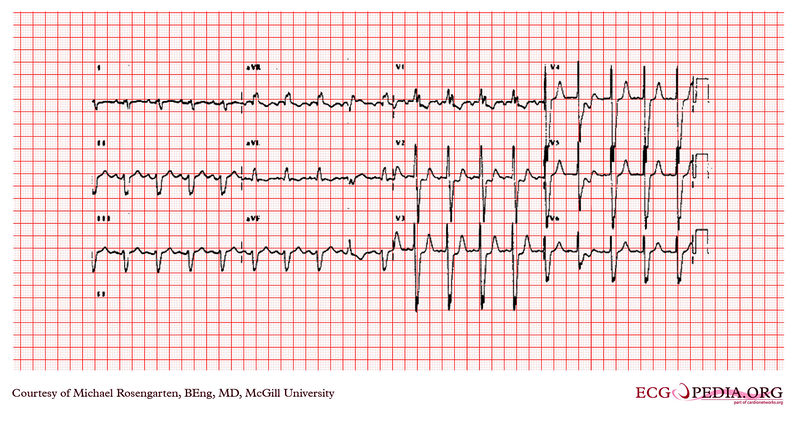
The rhythm is sinus. The QRS is wide (>120ms.) and the axis is markedly negative. There are small R waves in the inferior leads. The recording shows a right bundle branch block and a left anterior fasicular block.
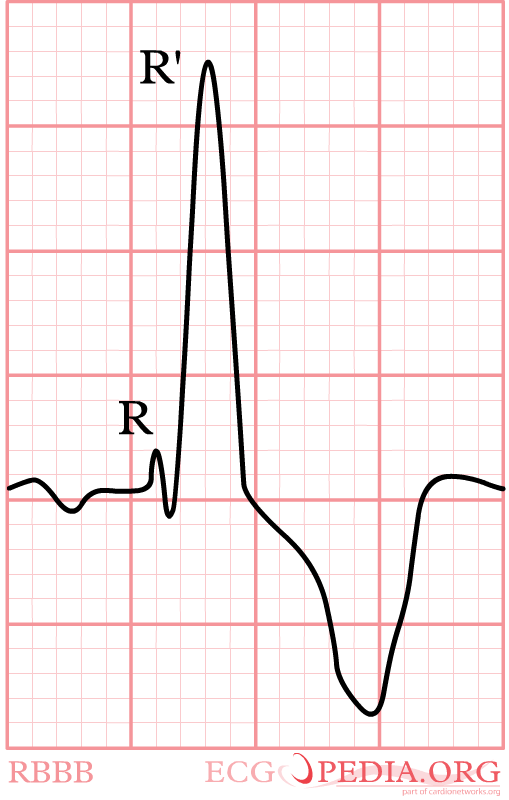
Below is an electrocardiogram showing the main characteristics of right bundle branch block on lead V1.
Below is an electrocardiogram showing right bundle branch block.
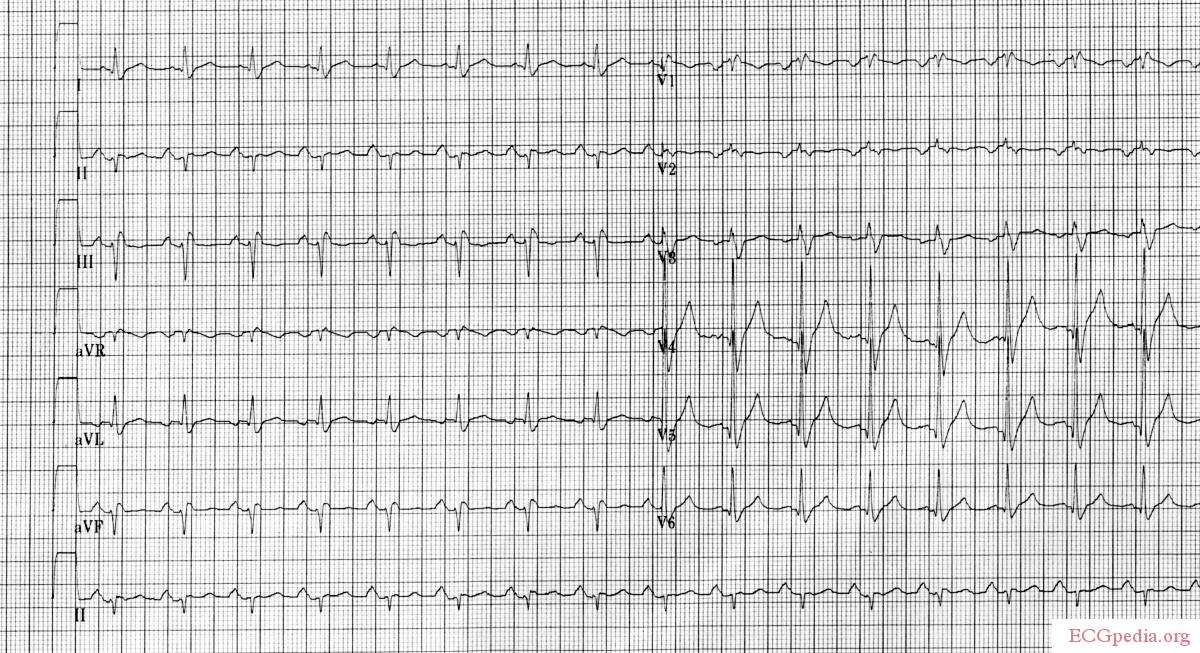
Below is an electrocardiogram showing right bundle branch block.
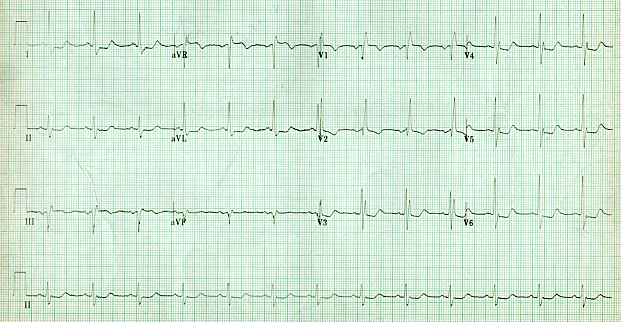
Below is an electrocardiogram showing right bundle branch block.
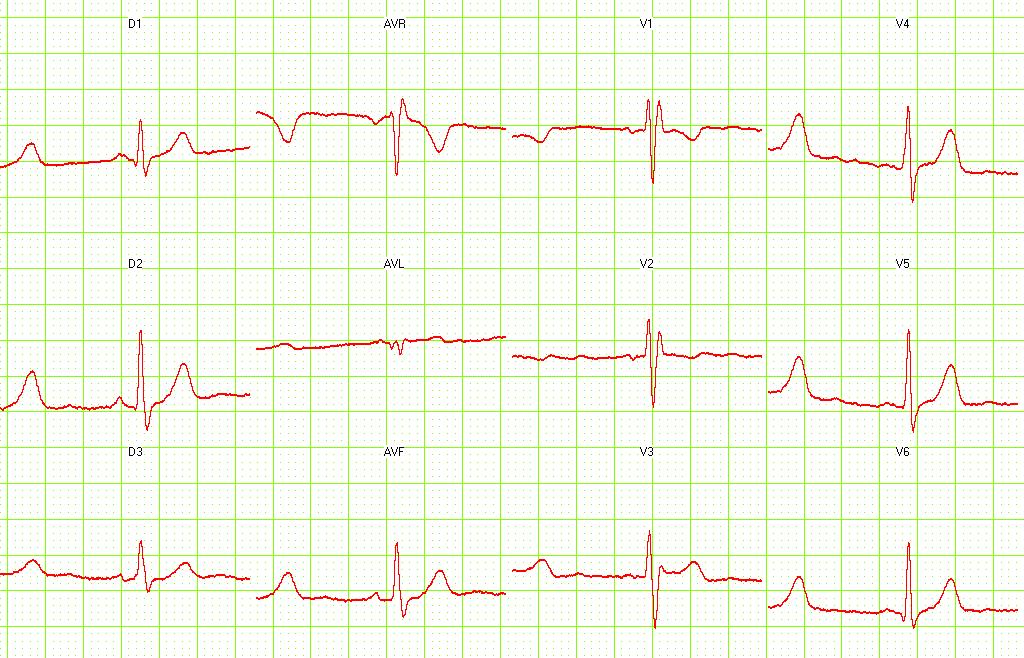
Below is an electrocardiogram showing right bundle branch block.
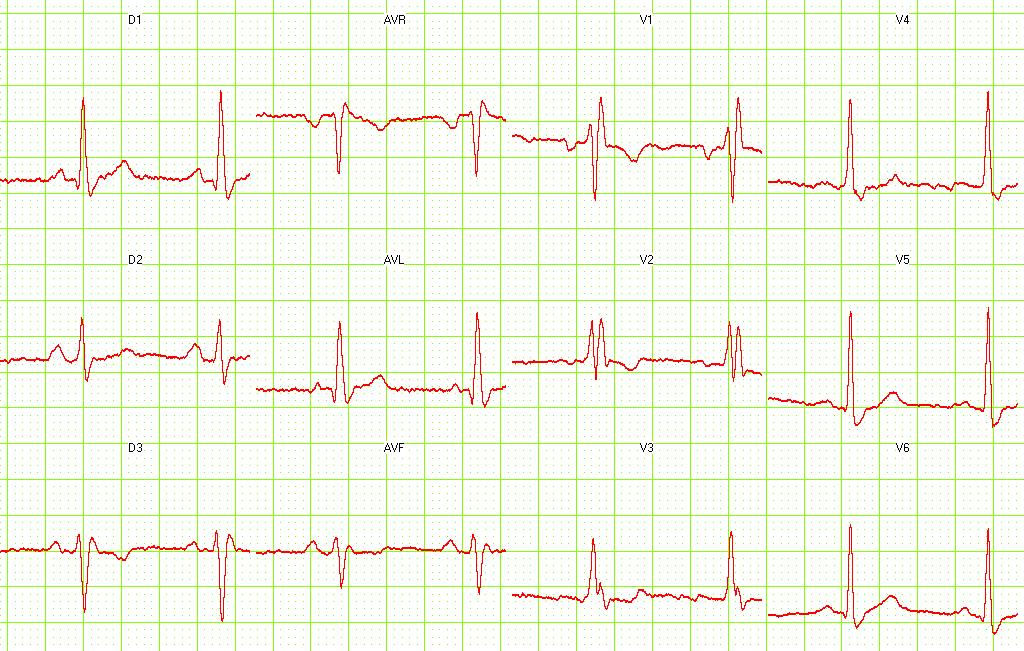
Below is an electrocardiogram showing right bundle branch block.
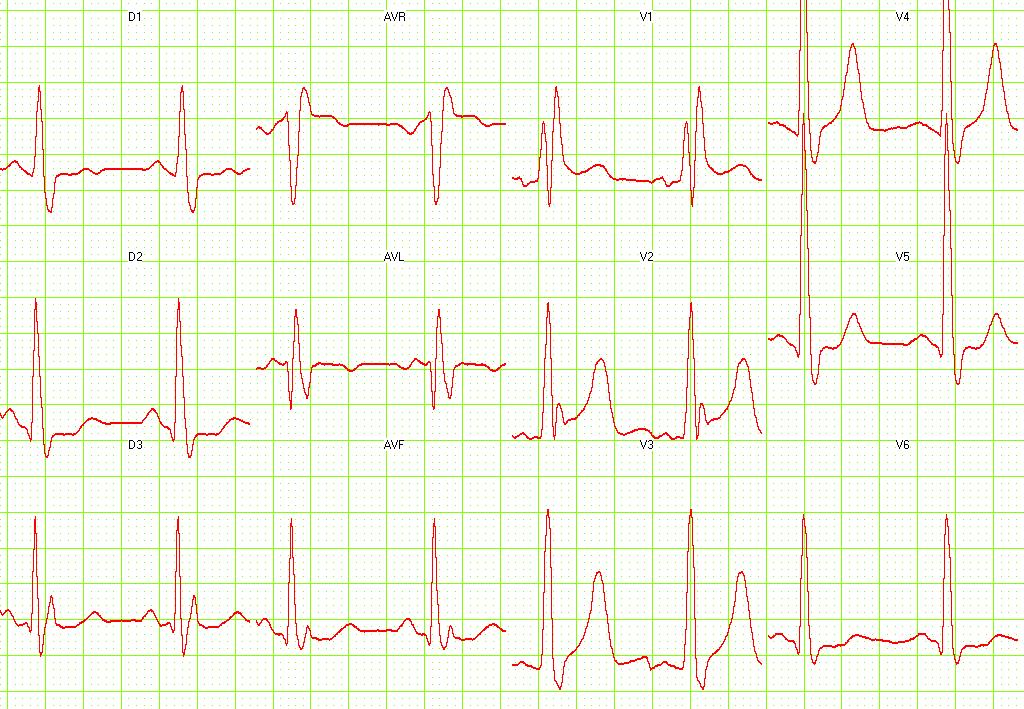
Below is an electrocardiogram showing right bundle branch block.
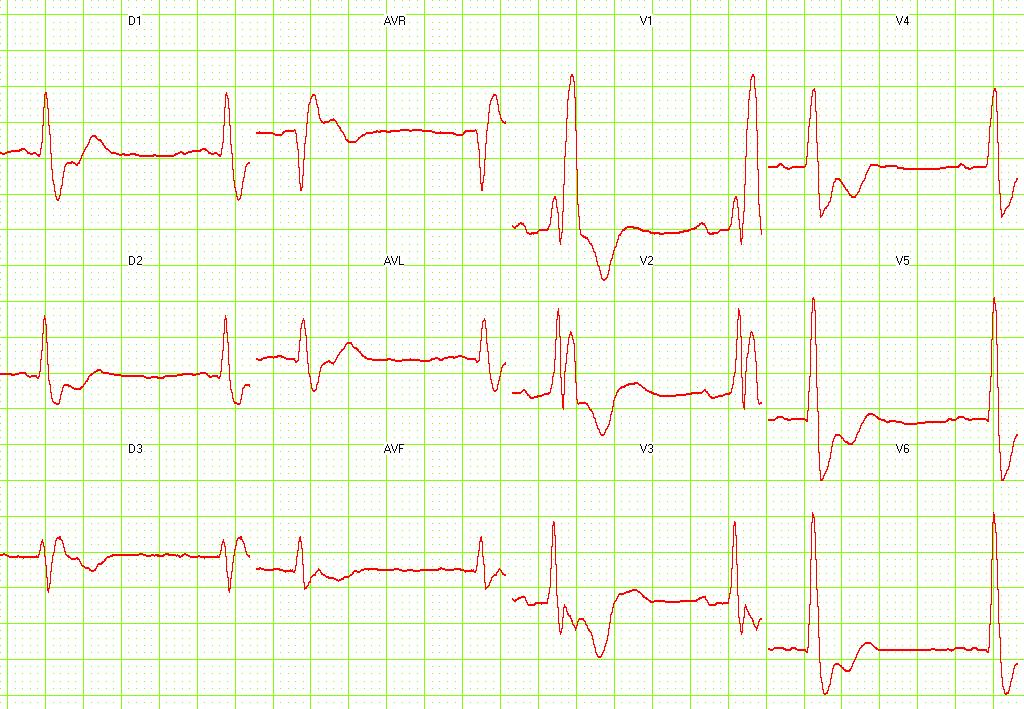
Below is an electrocardiogram showing right bundle branch block with first degree AV block.
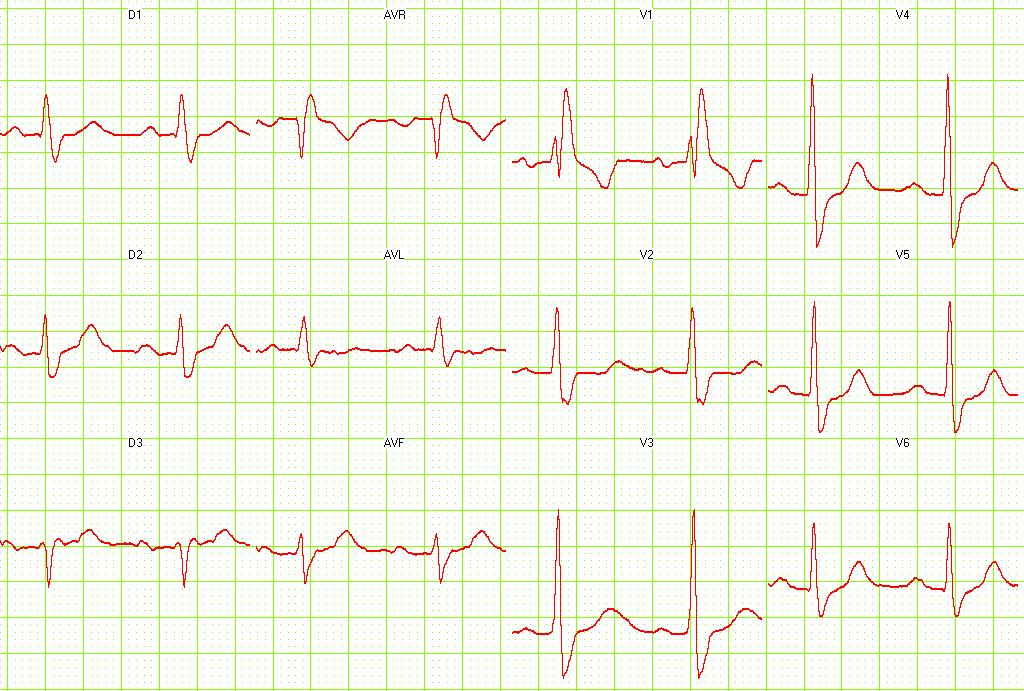
Below is an electrocardiogram showing right bundle branch block with right atrial hypertrophy.
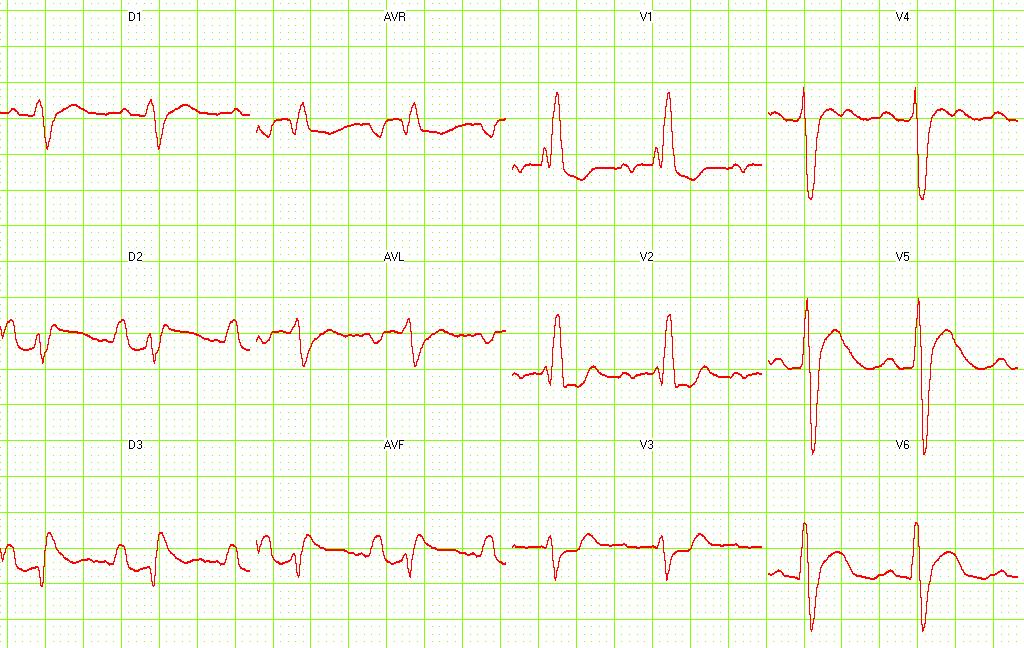
Electrocardiogram of the same patient. Of note here is ST elevation in lead V4R.
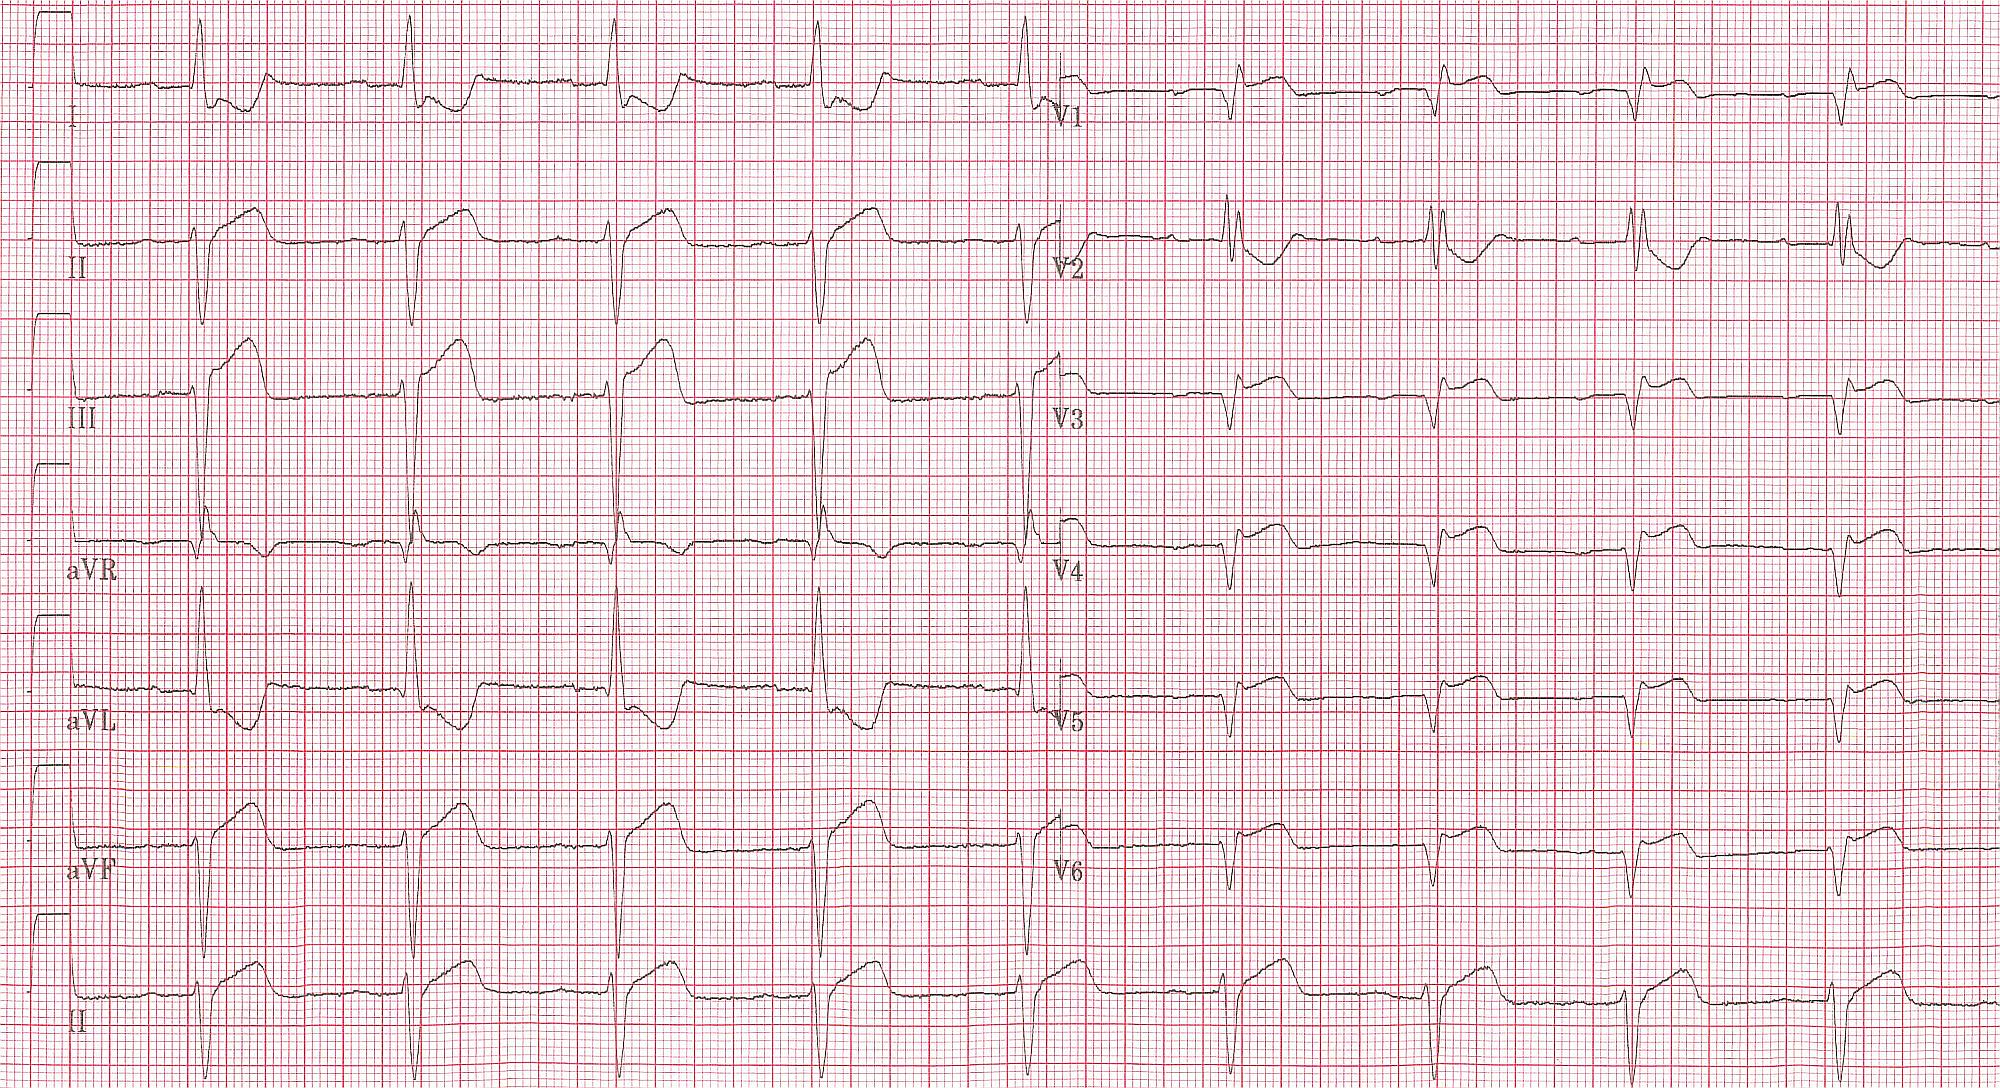
The same patient before acute MI developed. Horizontal axis shown.
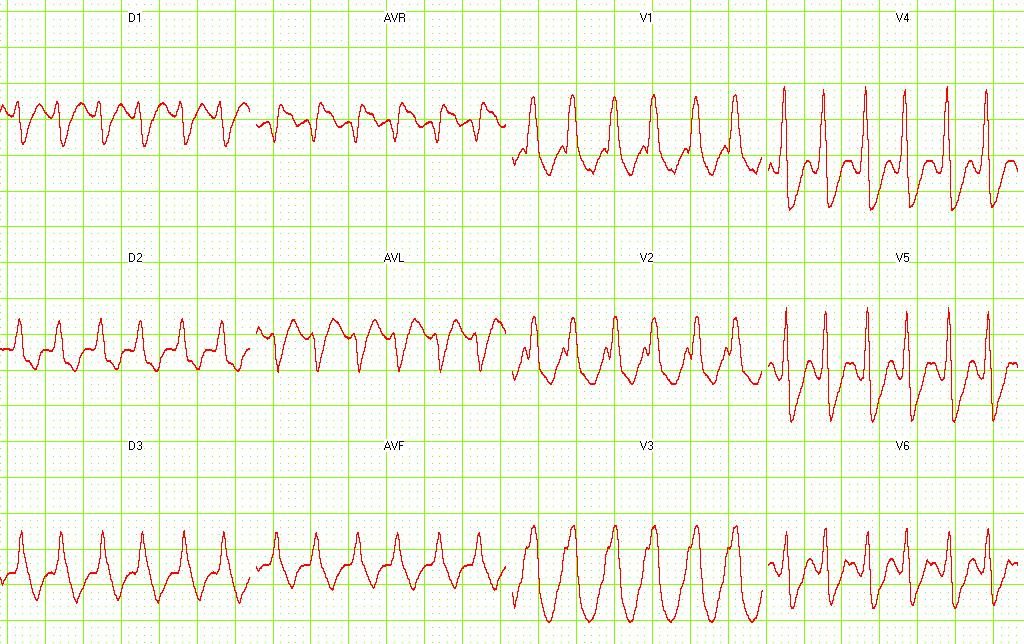
Below is an electrocardiogram of a patient with supraventricular tachycardia with RBBB.
Below is an electrocardiogram of a patient with old Anterior MI with RBBB.
.
Below is an electrocardiogram of a patient with Old Inferior MI and Anterior MI with RBBB and LAFB.
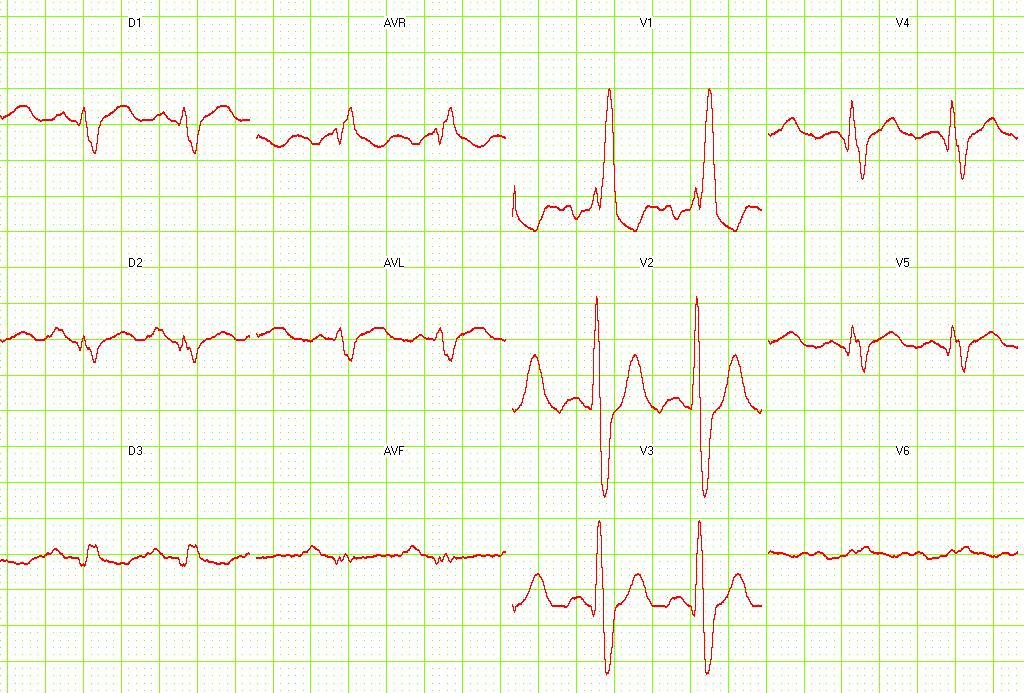
Below is an electrocardiogram of a patient with Old Inferior MI with RBBB
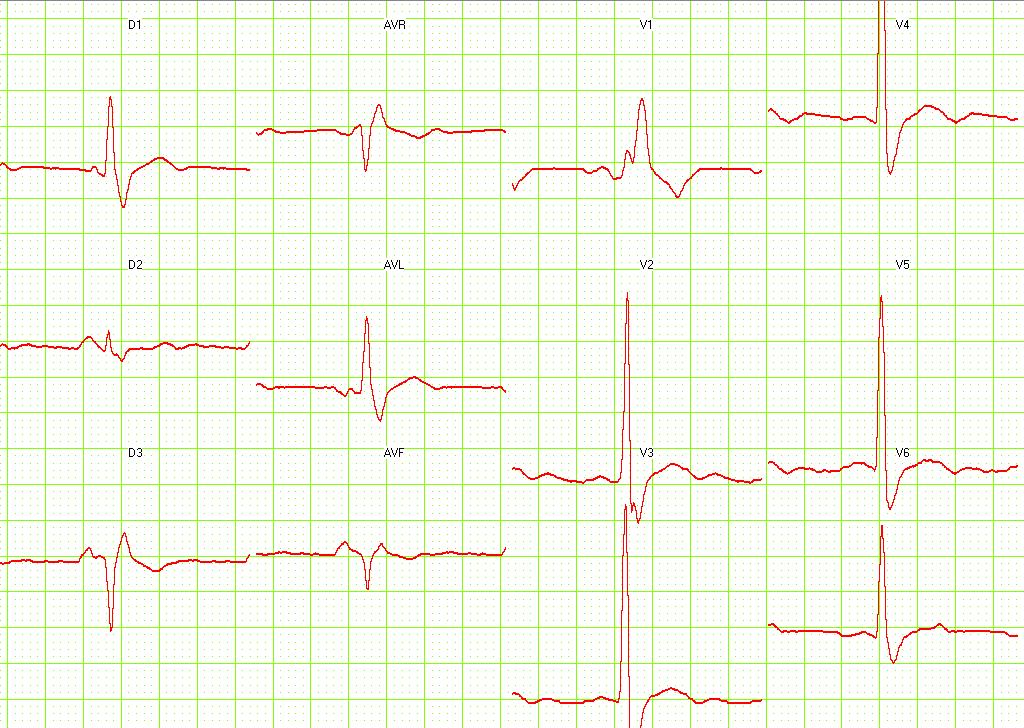
Below is an electrocardiogram of a patient with RBBB and LAFB.
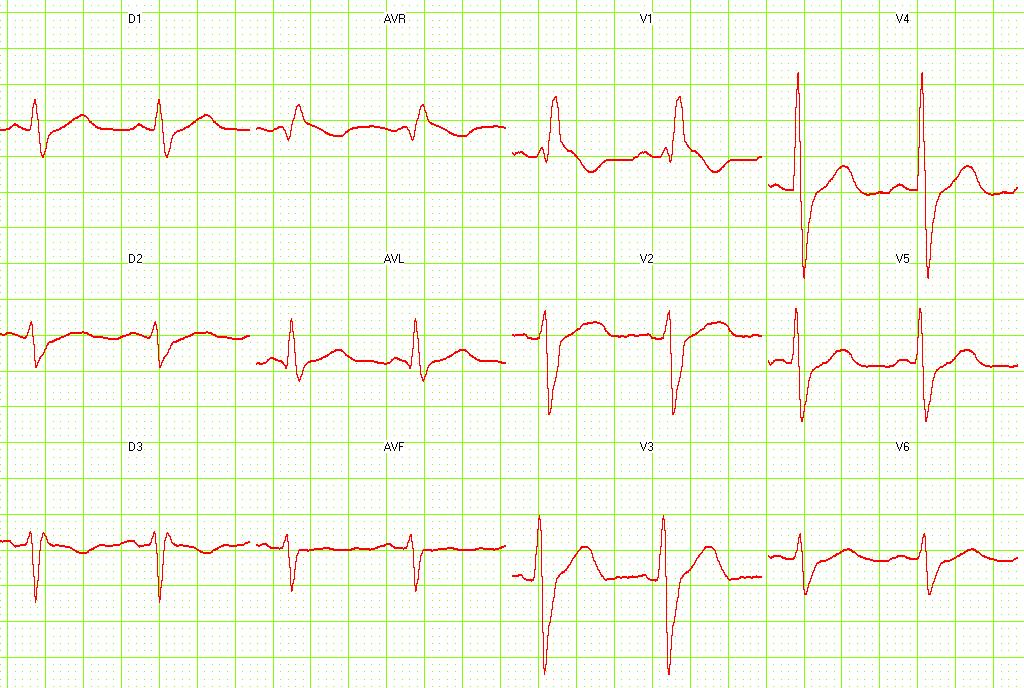
Below is an electrocardiogram of a patient with RBBB, LAFB and First Degree AV Block.
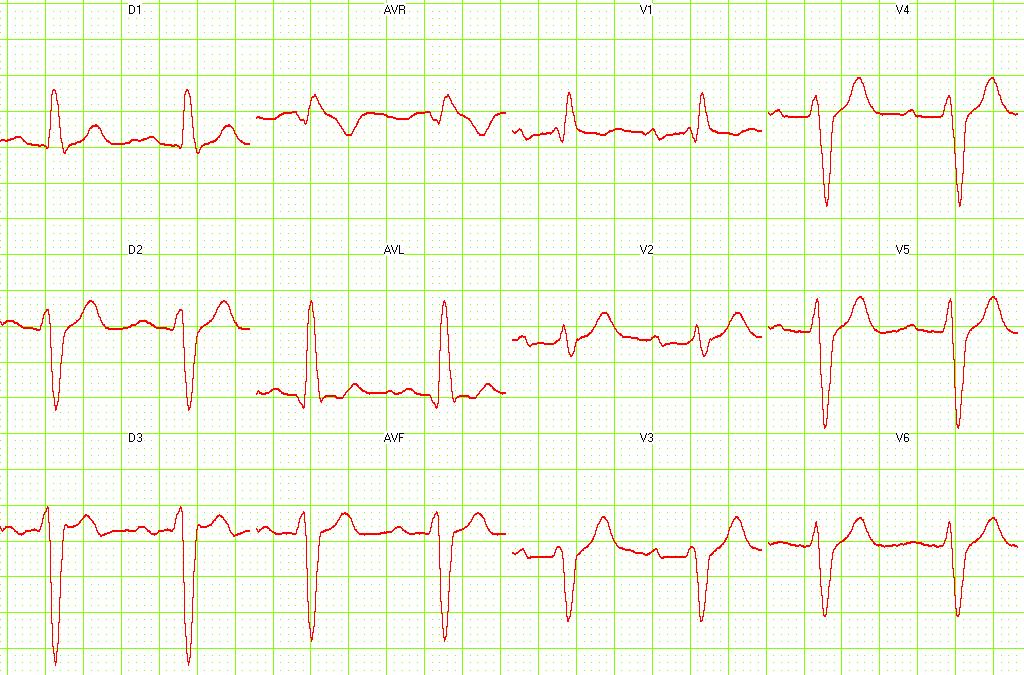
Below is an electrocardiogram of a patient with RBBB and LAFB.
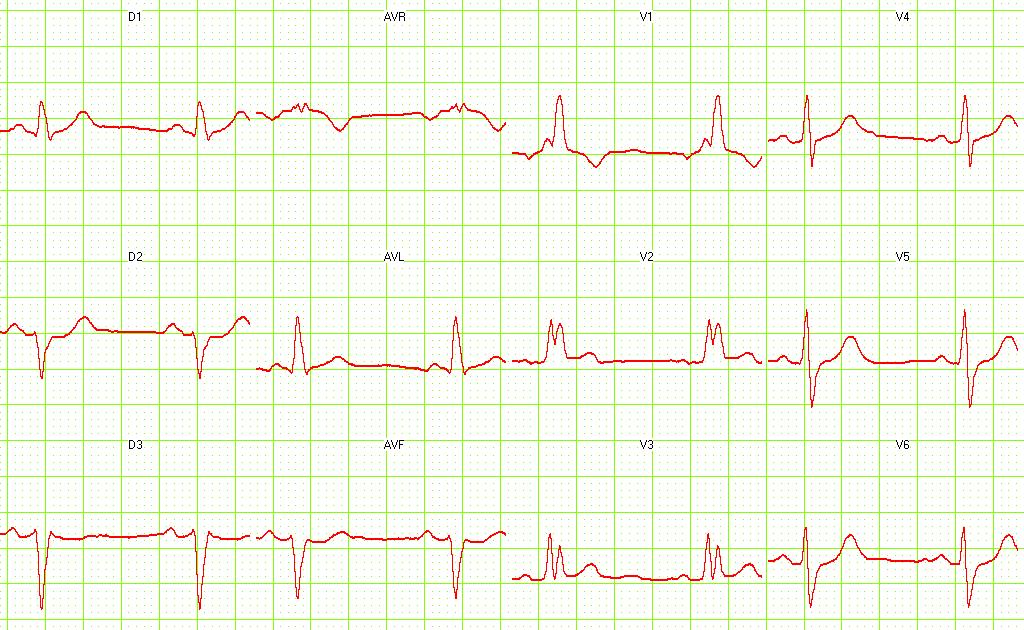
Below is an electrocardiogram of a patient with RBBB and LAFB.
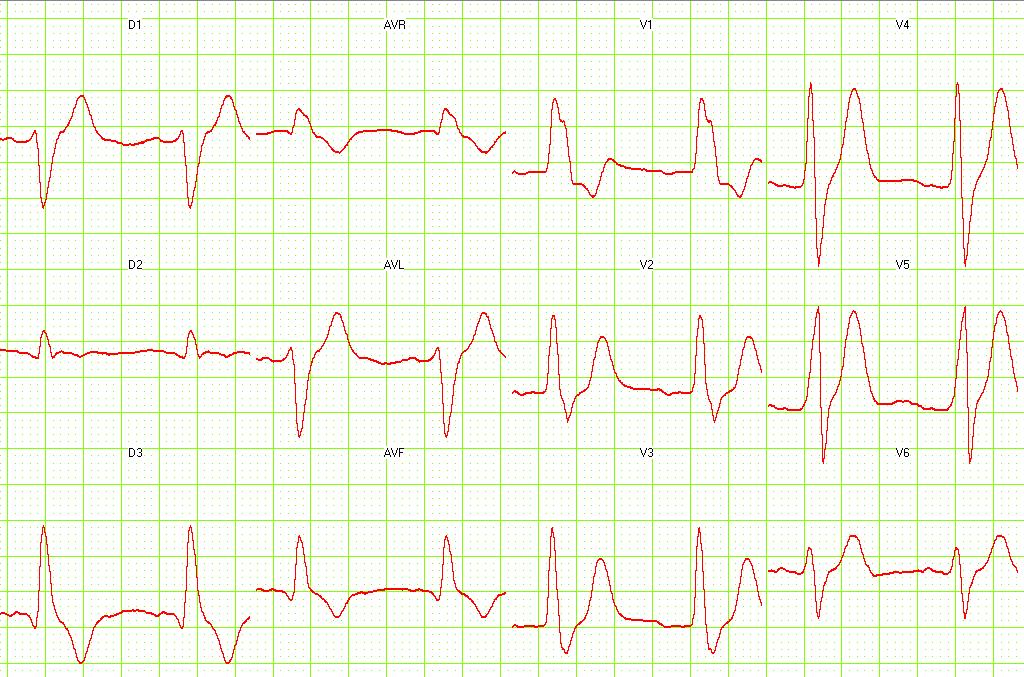
Below is an electrocardiogram of a patient with atrial fibrillation with a controlled ventricular rate. The QRS is wide (>120ms) and has a tall R' in V1 and an S wave in V6. There is a left axis deviation. The cardiogram suggests a right bundle branch block and a left anterior hemiblock. The patient has a cardiomyopathy with an ejection fraction of 20%.
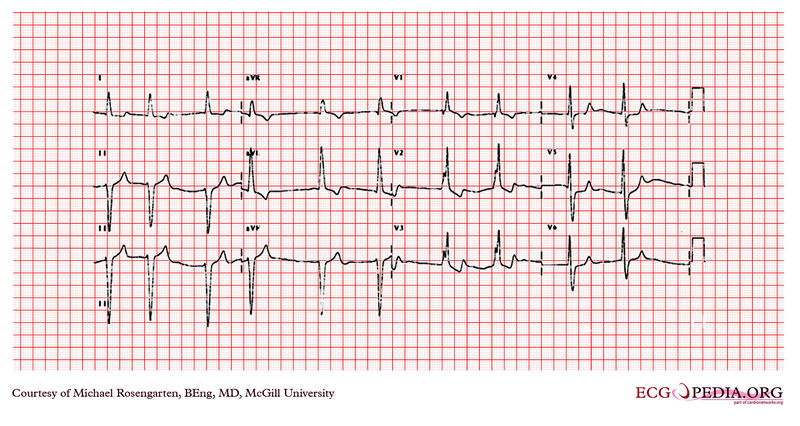
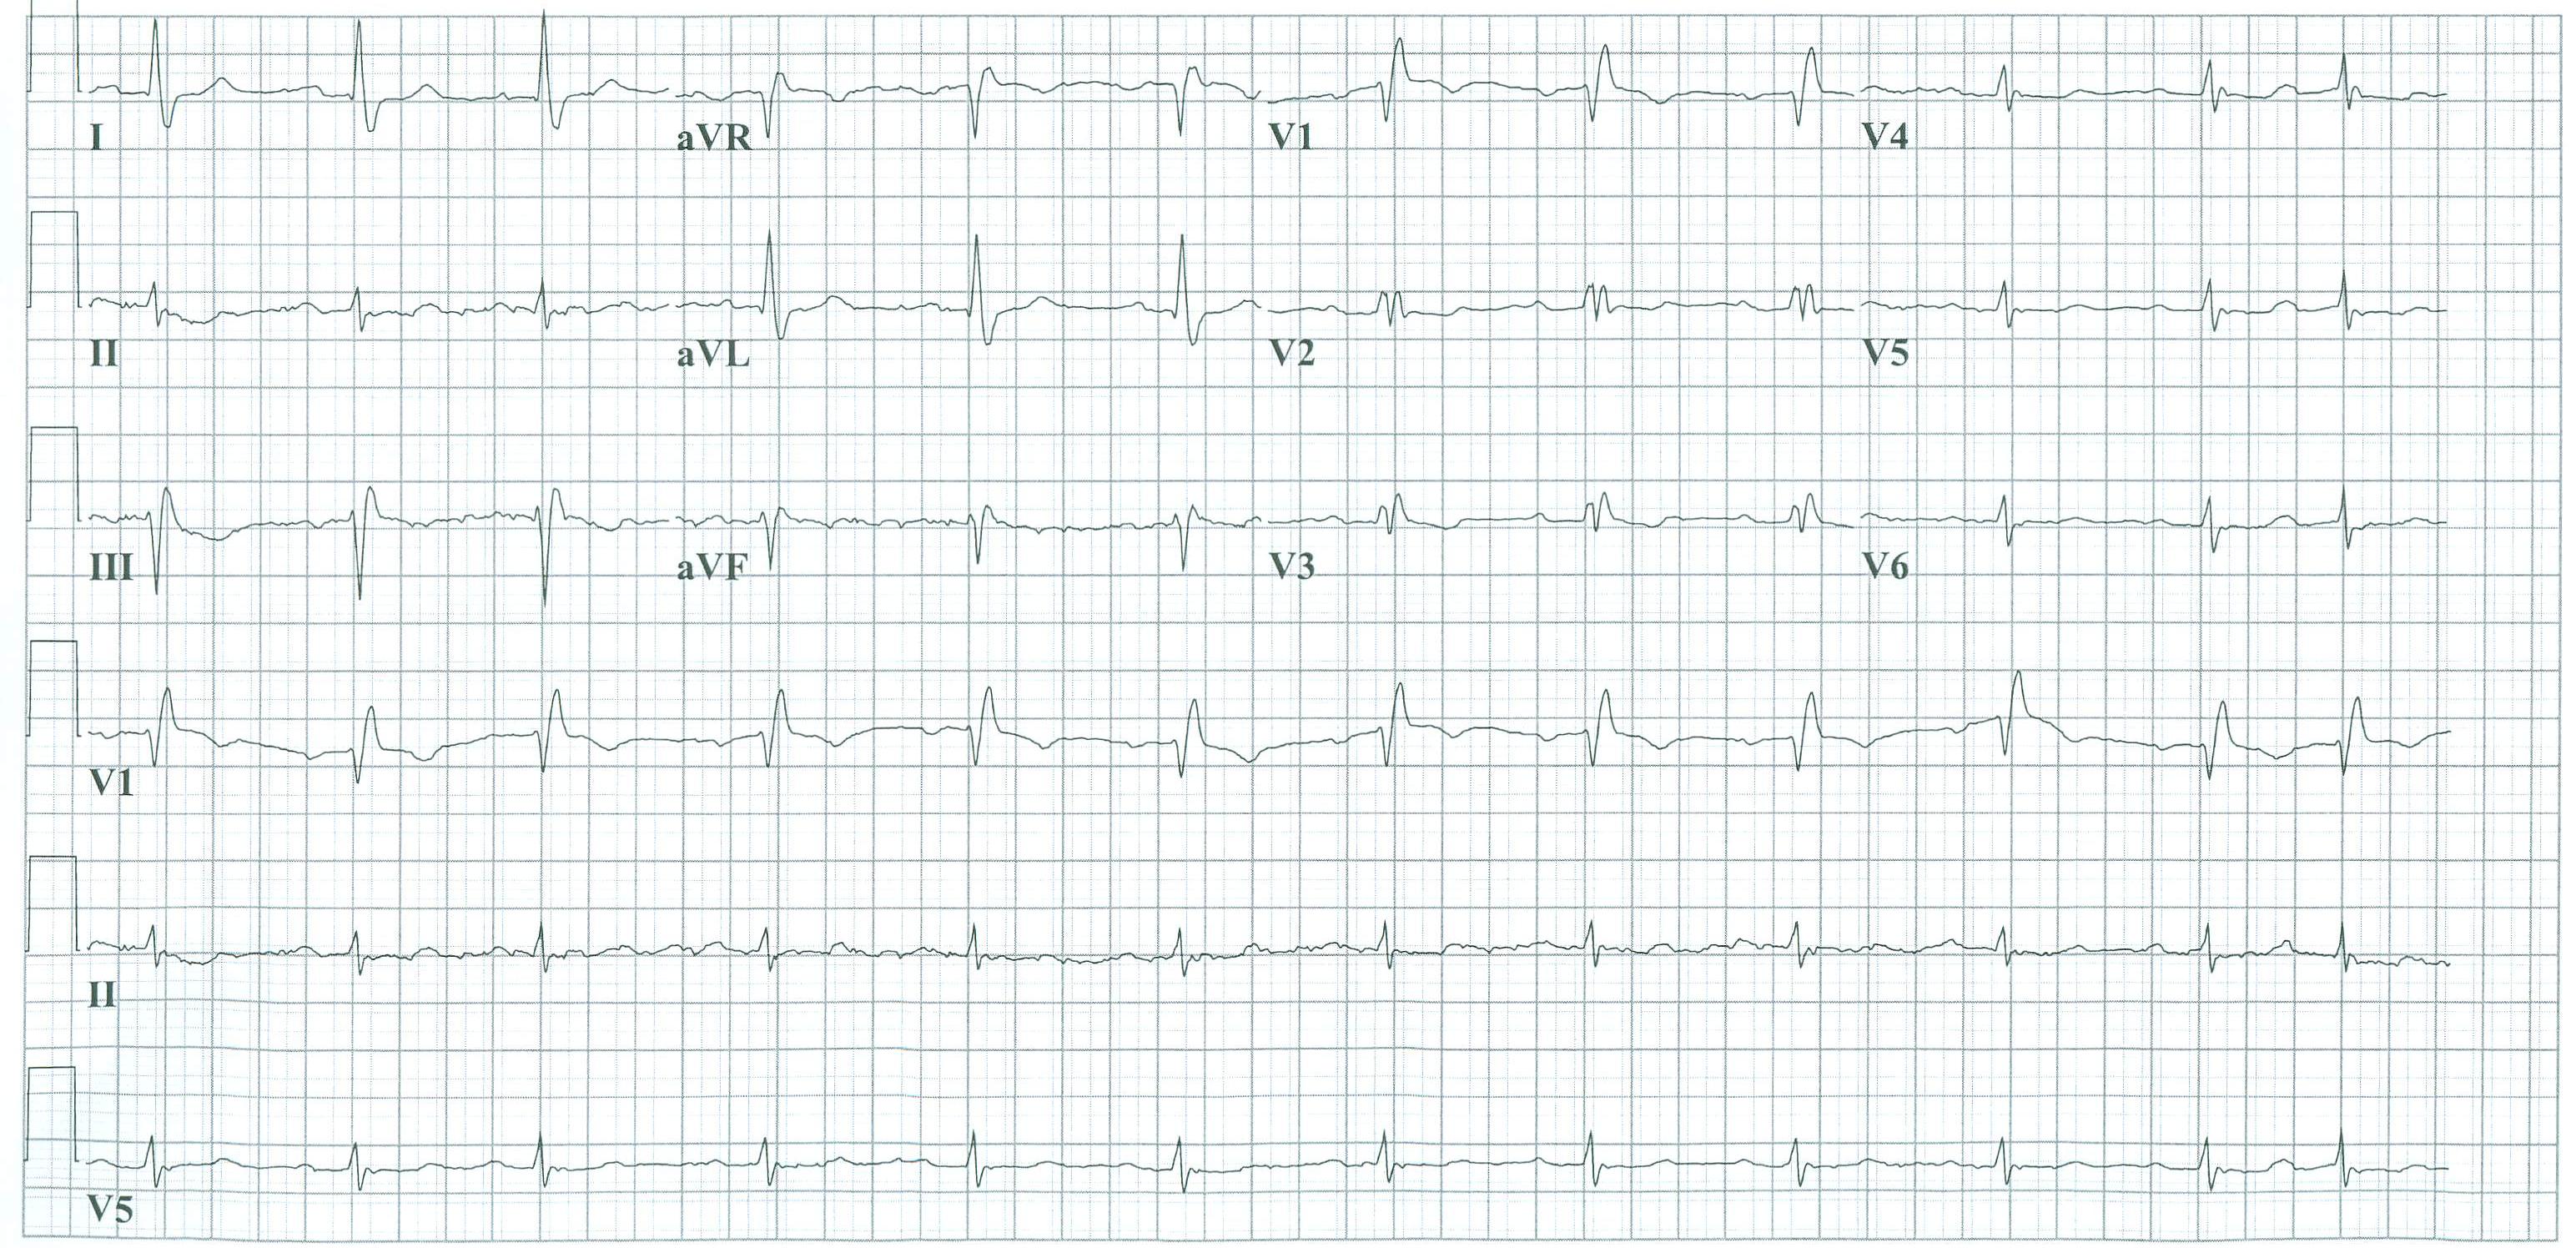
The cardiogram below shows sinus rhythm with a normal PR interval and a prolonged QRS interval (>120ms). There is a conduction abnormality best described as a right bundle branch block due to the rsR' wave in V1. Note the S wave in V6 which is due to the RBBB is smaller than the R wave in V6. The axis of the QRS is difficult to determine, but one usually looks at the first 60 ms. (1 1/2 small squares) to determine the axis with a RBBB. If the axis of the first 60 ms. of the QRS is more than 90 degrees and there is an rS in lead I and a Q in lead III then on would consider a left posterior fasicular block. This is not the case here.
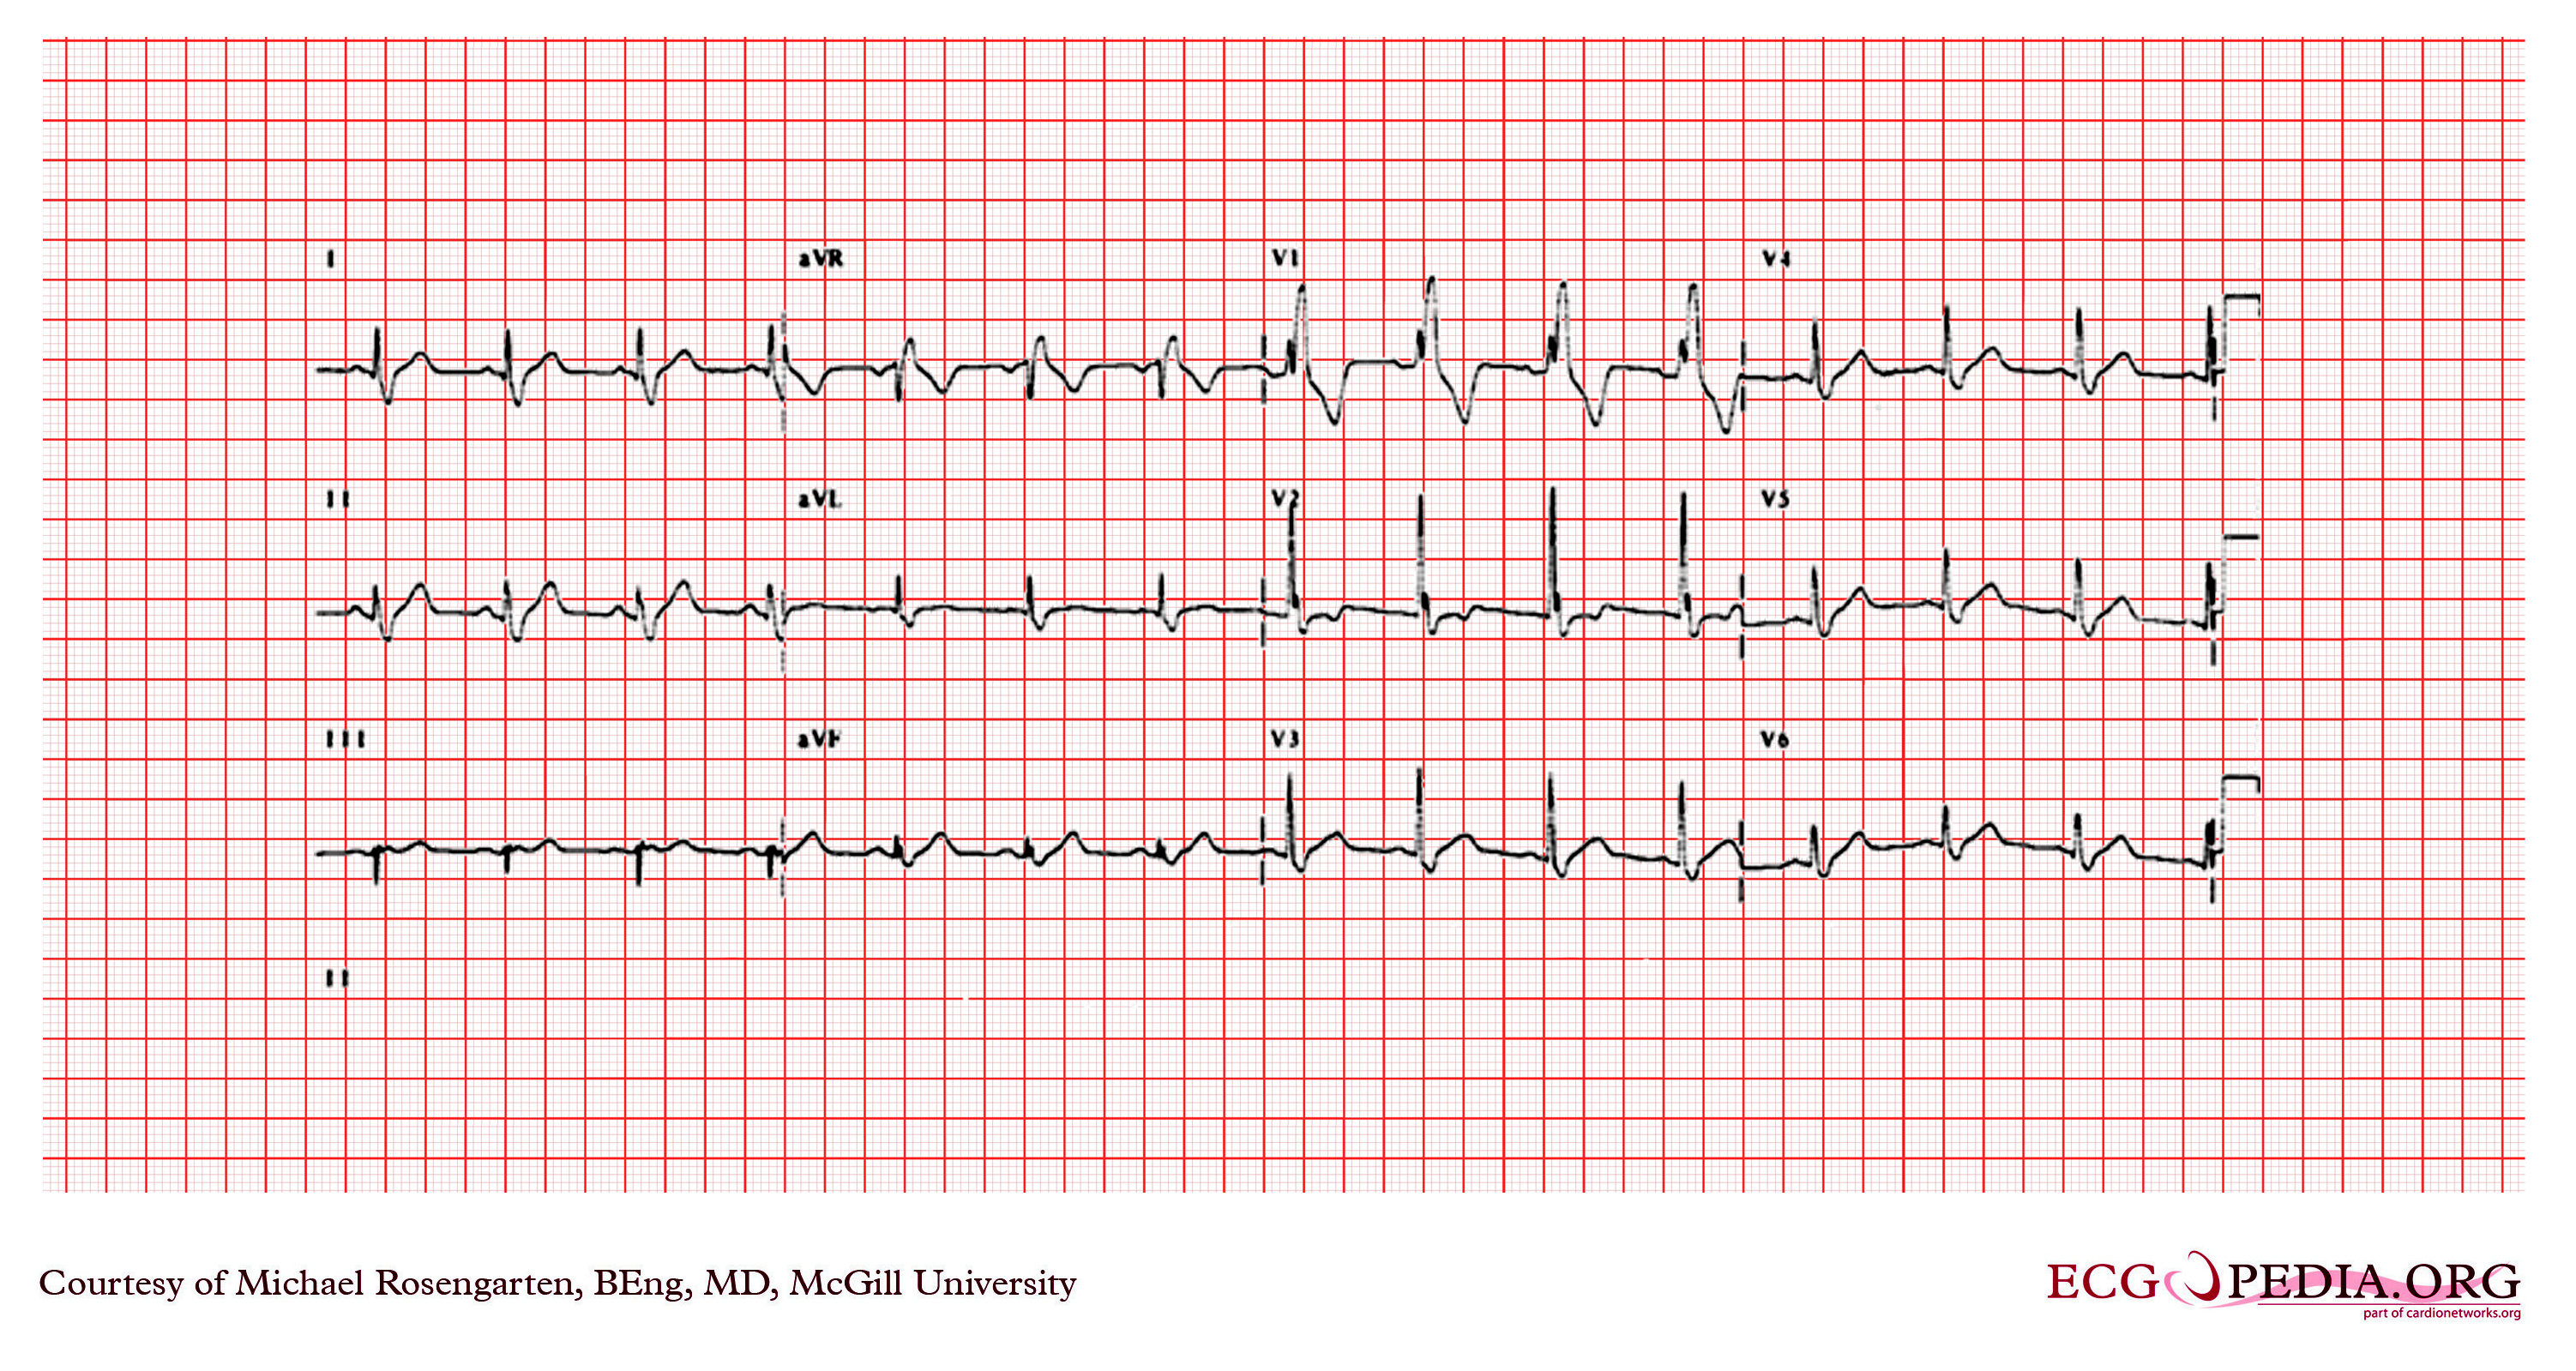
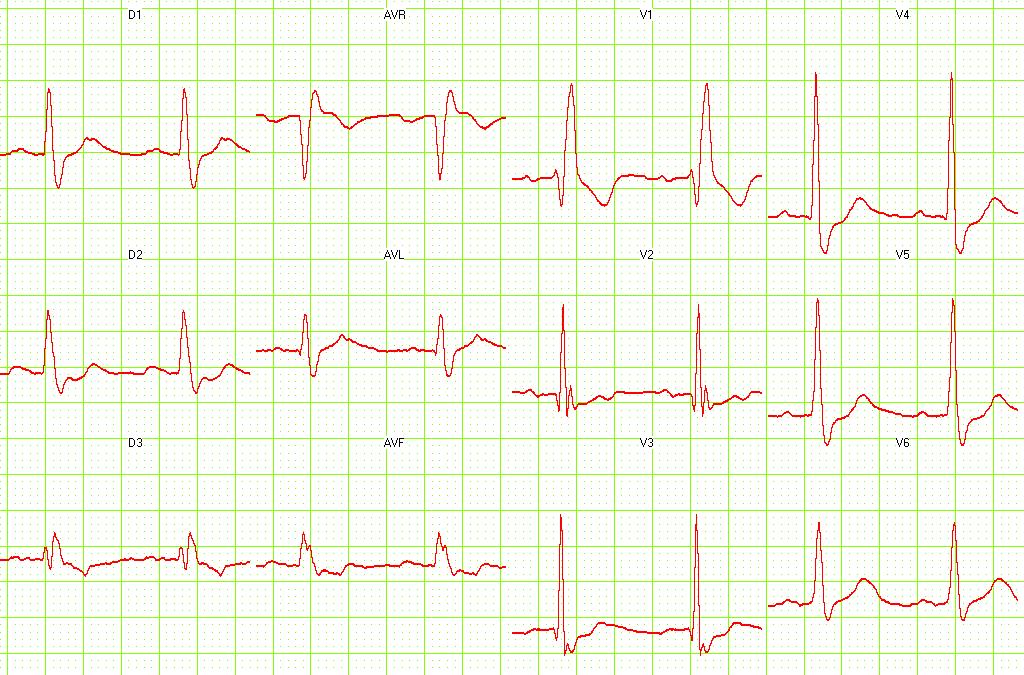
Below is an electrocardiogram of patient with RBBB
Sources
Copyleft images obtained courtesy of ECGpedia, http://en.ecgpedia.org/index.php?title=Special:NewFiles&offset=&limit=500.