Intraventricular conduction delay EKG examples
|
Intraventricular conduction delay Microchapters |
|
Differentiating Intraventricular conduction delay from other Disorders |
|---|
|
Diagnosis |
|
Treatment |
|
Case Studies |
|
Intraventricular conduction delay EKG examples On the Web |
|
to Hospitals Treating Intraventricular conduction delay EKG examples |
|
Risk calculators and risk factors for Intraventricular conduction delay EKG examples |
Editor-In-Chief: C. Michael Gibson, M.S., M.D. [1]; Associate Editor(s)-in-Chief: Mugilan Poongkunran M.B.B.S [2]
Overview
A narrow QRS complex requires highly synchronous electrical activation of the ventricular myocardium through the rapidly conducting His-Purkinje system (HPS). and intraventricular conduction delays (IVCDs) affects the morphology or duration, or both, of the QRS complex. These changes can be fixed and present at all heart rates, or they can be transient aberration either tachycardia or bradycardia dependent.
EKG Examples
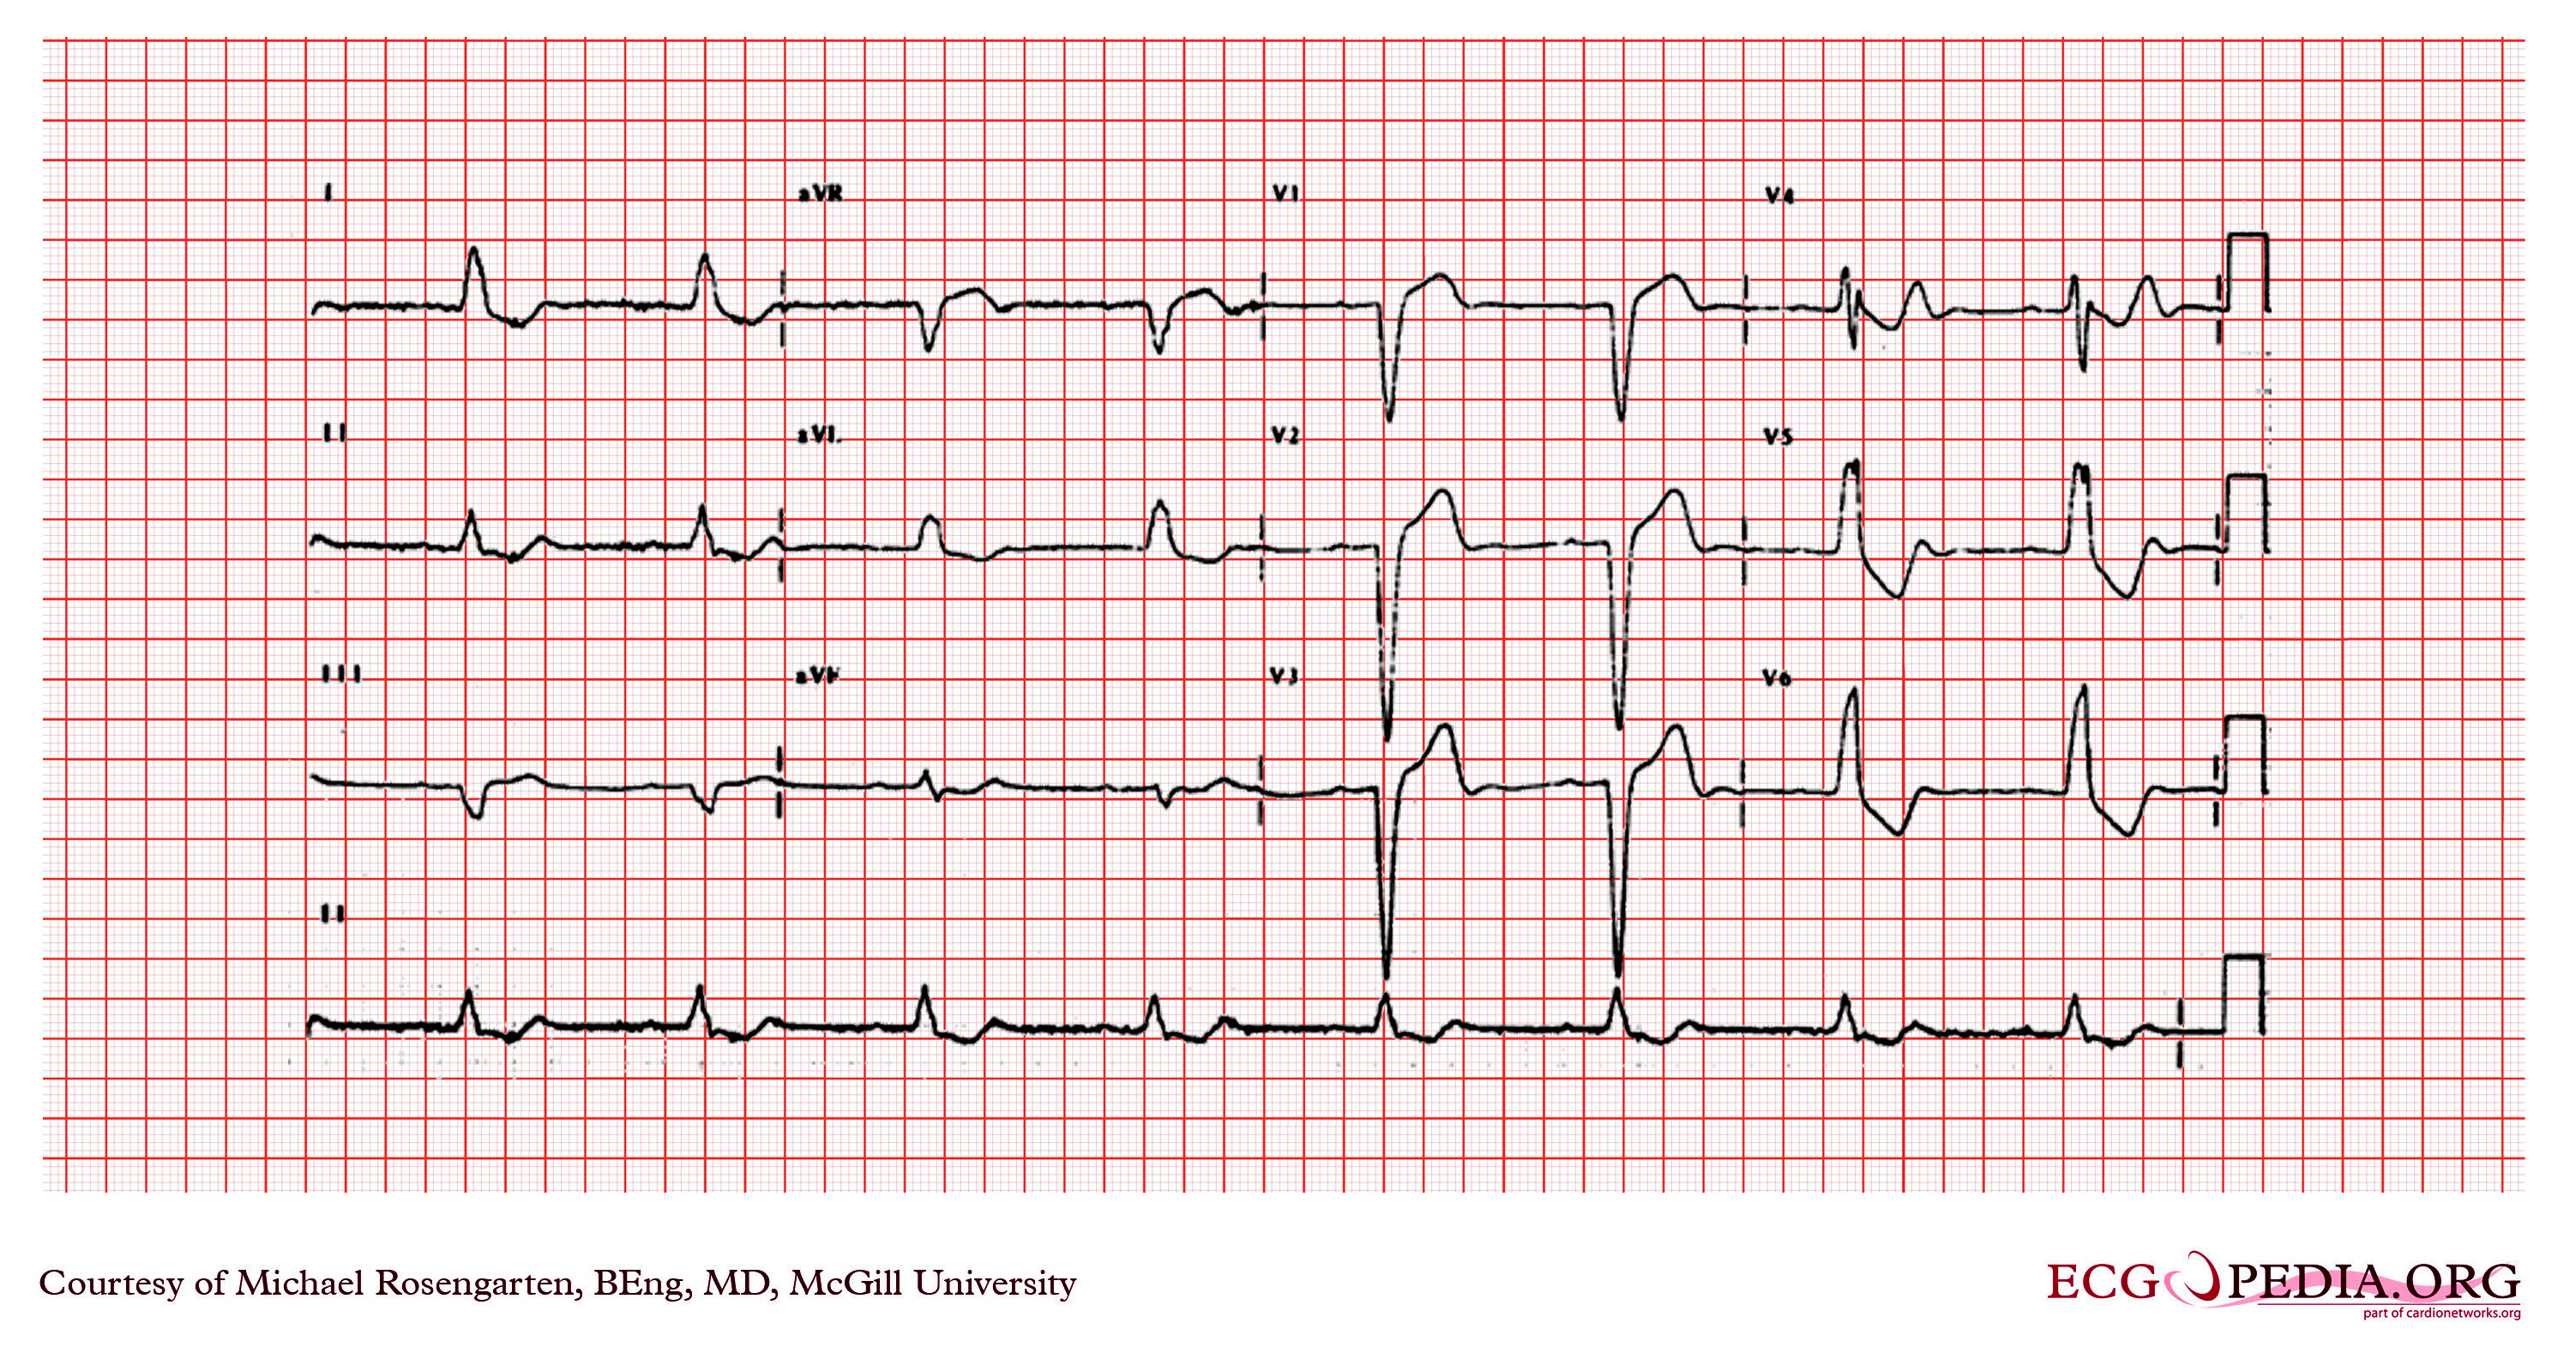
Left Bundle Branch Block
Shown below is an EKG with an RsR' pattern (M pattern) in leads V4 and V5 depicting a left bundle branch block. The EKG also shows sinus rhythm, prolonged PR interval (greater than 200ms), and wide QRS complexes (> 120ms). The loss of the septal Q waves and the tall broad R waves in leads I, aVL, and V6 are diagnostic of a left bundle branch block.

Copyleft image obtained courtesy of ECGpedia, http://en.ecgpedia.org/wiki/File:E203.jpg
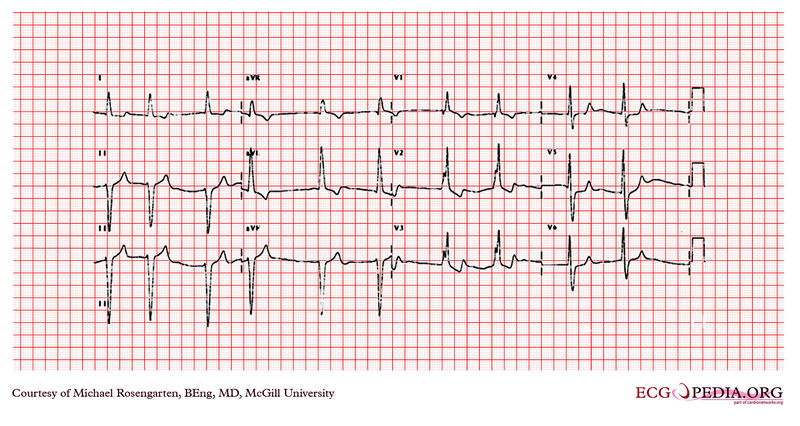
Bifascicular Block
Shown below is an EKG depicting atrial fibrillation with a controlled ventricular rate. The QRS is wide (>120ms) and has a tall R' inV1 and an S wave in V6. There is a left axis deviation. The cardiogram suggests a right bundle branch block and a left anterior hemiblock. The patient has a cardiomyopathy with an ejection fraction of 20%.

Copyleft image obtained courtesy of ECGpedia, http://en.ecgpedia.org/wiki/File:E243.jpg