WBR0867: Difference between revisions
Jump to navigation
Jump to search
Sergekorjian (talk | contribs) No edit summary |
m (refreshing WBR questions) |
||
| Line 1: | Line 1: | ||
{{WBRQuestion | {{WBRQuestion | ||
|QuestionAuthor={{SSK}} (Reviewed by Serge Korjian) | |QuestionAuthor= {{SSK}} (Reviewed by Serge Korjian) | ||
|ExamType=USMLE Step 1 | |ExamType=USMLE Step 1 | ||
|MainCategory=Pathophysiology | |MainCategory=Pathophysiology | ||
Latest revision as of 01:55, 28 October 2020
| Author | [[PageAuthor::Serge Korjian M.D. (Reviewed by Serge Korjian)]] |
|---|---|
| Exam Type | ExamType::USMLE Step 1 |
| Main Category | MainCategory::Pathophysiology |
| Sub Category | SubCategory::Pulmonology |
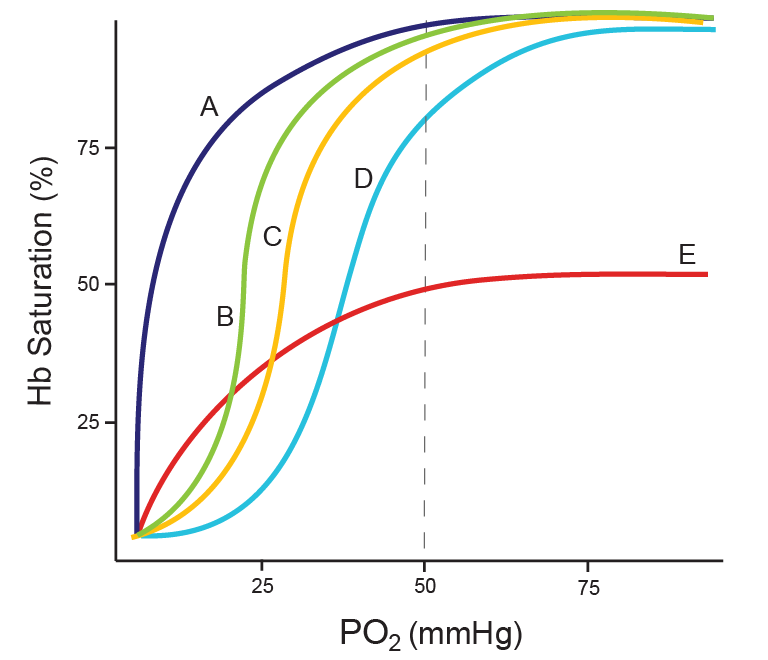
| Prompt | [[Prompt::A 42-year-old man is brought to the emergency department with altered mental status. He was reportedly found in the garage by his son where he had spent the afternoon working on fixing up the motor of his hot rod. EMS convey the suspicion of toxic fume inhalation. On admission, the patient is tachycardic and tachypneic, and is markedly confused. If the patient's oxygen dissociation curve is to be plotted, which of the following curves would closely fit his current presentation? |
| Answer A | AnswerA::A |
| Answer A Explanation | AnswerAExp::This curve refers to the oxygen dissociation trend of myoglobin, typically exponential not sigmoid in shape due to the lack of allosteric interactions. |
| Answer B | AnswerB::B |
| Answer B Explanation | [[AnswerBExp::This curve typically depicts a left shift of the normal oxygen dissociation curve seen in situations of hypothermia, alkalosis, and low CO2 concentrations.]] |
| Answer C | AnswerC::C |
| Answer C Explanation | [[AnswerCExp::This curve represents the normal oxygen dissociation curve with typical P50 (50% of Hemoglobin saturated) at approximately 26 mmHg of PO2.]] |
| Answer D | AnswerD::D |
| Answer D Explanation | [[AnswerDExp::This curve typically depicts a right shift of the normal oxygen dissociation curve seen in situations of hyperthermia, acidosis, exercise and high CO2 concentrations.]] |
| Answer E | AnswerE::E |
| Answer E Explanation | AnswerEExp::This curve depicts both a left shift and a decrease in hemoglobin saturation usually seen in patients with CO poisoning. |
| Right Answer | RightAnswer::E |
| Explanation | [[Explanation::Carbon monoxide (CO) is an odorless toxic gas released in the process of incomplete combustion. Hemoglobin binding sites have 250 times better affinity to CO than to oxygen. This would typically cause rapid binding of CO as well as cause conformational changes in the hemoglobin molecule leading to increased affinity to oxygen. While CO occupies oxygen binding sites, it decreases the oxygen saturation of hemoglobin. In addition, as it increases affinity of hemoglobin to oxygen it causes a left shift leading to a decrease in oxygen dissociation at the peripheral tissues. Both of those phenomena combined would lead to the red curve seen in the graph above. Educational Objective: Carbon monoxide poisoning causes 2 distinct effects on the oxygen dissociation curve: a left shift and a decrease in hemoglobin oxygen saturation. |
| Approved | Approved::Yes |
| Keyword | WBRKeyword::CO poisoning, WBRKeyword::Oxygen dissociation curve, WBRKeyword::Oxygen, WBRKeyword::Carbon monoxide, WBRKeyword::P50, WBRKeyword::Hypothermia, WBRKeyword::Alkalosis, WBRKeyword::Hypercapnia |
| Linked Question | Linked:: |
| Order in Linked Questions | LinkedOrder:: |
