Stroke case study one

Revision as of 17:02, 6 February 2013 by Kalsang Dolma (talk | contribs) (→‎Histopathological Findings)
(diff) ← Older revision | Latest revision (diff) | Newer revision → (diff)
Jump to navigation Jump to search

Stroke Main page

Patient Information

Overview

Causes

Classification

Hemorrhagic stroke
Ischemic stroke

Differentiating Stroke from other Diseases

Epidemiology and Demographics

Diagnosis

NIH stroke scale
Glasgow coma scale

Epidemiology and Demographics

Risk Factors

Screening

Natural History, Complications and Prognosis

Diagnosis

Diagnostic Study of Choice

History and Symptoms

Physical Examination

Laboratory Findings

Electrocardiogram

X-ray

Echocardiography and Ultrasound

CT scan

MRI

Other Imaging Findings

Other Diagnostic Studies

Treatment

Medical Therapy

Interventions

Surgery

Primary Prevention

Secondary Prevention

Cost-Effectiveness of Therapy

Future or Investigational Therapies

Case Studies

Case #1

Stroke case study one On the Web

Most recent articles

Most cited articles

Review articles

CME Programs

Powerpoint slides

Images

American Roentgen Ray Society Images of Stroke case study one

All Images
X-rays
Echo & Ultrasound
CT Images
MRI

Ongoing Trials at Clinical Trials.gov

US National Guidelines Clearinghouse

NICE Guidance

FDA on Stroke case study one

CDC on Stroke case study one

Stroke case study one in the news

Blogs on Stroke case study one

Directions to Hospitals Treating Psoriasis

Risk calculators and risk factors for Stroke case study one

Editor-In-Chief: C. Michael Gibson, M.S., M.D. [1]

Case #1

Clinical Summary

Eight years prior to his demise, this 48-year-old black male had a dissecting aortic aneurysm. The first portion of the aortic arch was dilated with an associated aortic valve insufficiency.

The defect was repaired and a mechanical prosthetic valve was implanted. One year prior to his terminal admission, the patient experienced a catastrophic cerebrovascular accident (CVA) with left hemiparesis and obtundation. The patient experienced severe neurologic sequelae from this CVA and was eventually transferred to a nursing home where he was bedbound and required an indwelling urinary catheter.

The patient developed a urinary tract infection and was transferred to the hospital. The patient's condition deteriorated and he died 6 weeks after admission with a urinary tract infection and pneumonia.

Autopsy Findings

Autopsy showed the expected findings in the aorta and in a 760-gram heart. The mechanical valve showed some deterioration and there was old thrombotic material adherent to the valve, which was probably the source of the emboli which caused the patient's CVA. The patient's 1250-gram brain showed extensive old infarctions in at least three different areas, with the largest (12.5 x 5.5 cm) in the distribution of the right middle cerebral artery.

Gross Pathology

Images courtesy of Professor Peter Anderson DVM PhD and published with permission © PEIR, University of Alabama at Birmingham, Department of Pathology

This is a gross photograph of the brain which contains two areas of infarction (arrows).


This is a gross photograph of a cross-section of brain demonstrating the areas of infarction (arrows).


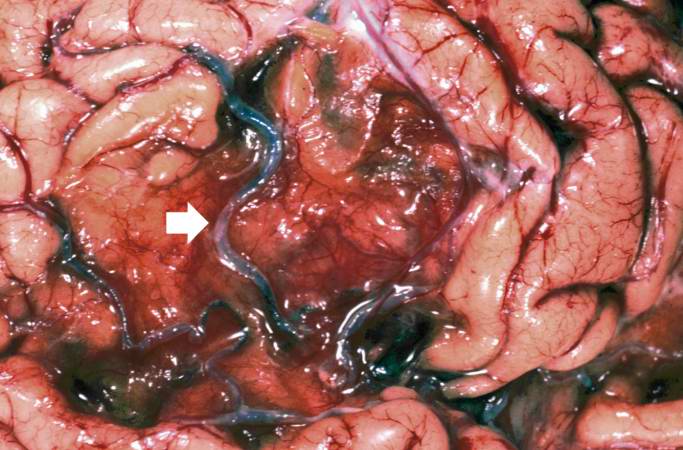
This is a gross photograph of a brain from another patient with an old healed infarct. Note the meninges overlying the infarcted region (arrow).


This is a closer view of the brain demonstrating an old healed infarct with the meninges containing blood vessels (arrow) overlying the infarcted region.


Microscopic Pathology

This is a photomicrograph of the edge of the infarct. Note the numerous inflammatory cells in the brain parenchyma and adjacent to the remaining brain tissue (arrows).


This is a low-power photomicrograph of brain at the edge of the infarct. Note the loss of brain parenchyma (arrows).


This is a higher-power photomicrograph of the previous image showing that the inflammatory cells (arrows) are primarily macrophages and microglia which have phagocytosed the dead brain tissue.


This is a photomicrograph of brain tissue adjacent to the area of infarction. There are numerous activated gemistocytic astrocytes (arrows).


This is a photomicrograph of the edge of the infarct. The macrophages that are full of brain tissue (“gitter cells”) are at the top of the image (arrows) and the brain parenchyma containing gemistocytic astrocytes is at the bottom.


This is a high-power photomicrograph of gitter cells (arrows).


This is a photomicrograph of the edge of the infarct. Note the gitter cells, gemistocytic astrocytes, and some hemosiderin-laden macrophages (arrows).


References


Template:WS Template:WH