How to read an ECG: Difference between revisions
Rim Halaby (talk | contribs) No edit summary |
Rim Halaby (talk | contribs) |
||
| Line 90: | Line 90: | ||
==Cardiac Axis== | ==Cardiac Axis== | ||
The cardiac axis is an imaginary vector corresponding to the average of the different depolarization vectors in the heart. | The cardiac axis is an imaginary vector corresponding to the average of the different depolarization vectors in the heart. The depolarization wave begins in the right atrium and spread to the left and right ventricle. Because the left ventricle wall muscle mass is larger than the right wall muscle mass, the arrow representing the direction of the depolarization wave is directed towards the left. | ||
===The limb leads look at heart in a vertical plan=== | ===The limb leads look at heart in a vertical plan=== | ||
*The normal depolarization vector is towards leads I, II and III. Hence, the deflections in these leads are positive in such a way that the deflection in lead II is more positive than that in leads I and III. | *The normal depolarization vector is directed towards leads I, II and III. Hence, the deflections in these leads are positive in such a way that the deflection in lead II is more positive than that in leads I and III. | ||
*The shapes of the QRS complex in leads I, II ad III are used to estimate the cardiac axis. | *The shapes of the QRS complex in leads I, II ad III are used to estimate the cardiac axis. | ||
*Keep in mind that: | |||
**When the depolarization is directed towards the lead, the ECG recording in that lead will show positive deflection. | |||
**When the depolarization is directed away from the lead, the ECG recording in that lead will show negative deflection. | |||
**A positive deflection is defined as the QRS having a larger 'area under the curve' above the baseline than below the baseline | |||
*The normal cardiac axis lies between the angles: -30 and +90 degrees. | *The normal cardiac axis lies between the angles: -30 and +90 degrees. | ||
Revision as of 13:44, 19 October 2012
Editor-In-Chief: C. Michael Gibson, M.S., M.D. [1]; Assistant Editor(s)-in-Chief: Rim Halaby
Overview
The interpretation of an ECG should be done in a consistent step-by-step way. Each ECG should be evaluated for the following:
- Rhythm
- Rate
- Conduction
- PR interval
- QRS duration
- QT duration
- Heart axis
- P wave morphology
- QRS morphology
- ST morphology
- Compare the current ECG to previous ECG
Rhythm
The sinus node (SA), located in the roof of the right atrium, is the fastest physiological pacemaker. When the sinus node generates an electrical impulse, the surrounding cells of the right atrium depolarize. Then the depolarization wave spreads to the cells of the left atrium, the AV (atrioventricular) node, the bundle of His and then to the ventricles through the purkinje fibers.
In order to evaluate the rhythm, several parameters must be checked:
- The presence of a P wave
- A rhythm is sinus when every P wave is always followed by a QRS wave
- P wave is absent in atrial fibrillation, junctional or ventricular rhythm
- The P wave morphology
- The P wave corresponds to atrial contraction
- Normal P waves are similar in shapes in the same lead
- Variable morphologies of P waves in a single ECG lead is suggestive of an ectopic pacemaker rhythm such as wandering pacemaker or multifocal atrial tachycardia
- The maximum height of the P wave is 2.5 mm in II and/or III
- The regularity of the waves
- The distance between two R waves, called RR interval, is constant in a regular rhythm
- When the RR interval is not constant, the rhythm is said irregular. When the rhythm is irregularly irregular it is a sign of the presence of atrial fibrillation.
Rate
- The normal heart rate is between 60 and 100 beats per minutes
- A heart rate less than 60 or larger than 100 is called bradycardia and tachycardia respectively
- It is important to remember the temporal significance of the small and large squares on an ECG strip. See the picture below for a detailed explanation:

- Determining the heart rate can be done using one of these three methods:
- First method: Counting the squares
- Use the sequence 300-150-100-75-60-50-43-37. Count from the first QRS complex, the first thick line is 300, the next thick line 150 etc. Stop the sequence at the next QRS complex. When the second QRS complex is between two lines, take the mean of the two numbers from the sequence

- Second method:
- The ECG paper runs at 25 mm/sec through the ECG printer; therefore:

- Third method:
- Count the number of QRS complexes that fit into 3 seconds (some ECG writers print this period on the ECG paper). Multiply this number by 20 to find the number of beats/minute.
- First method: Counting the squares

Evaluation of the Conduction
The evaluation of the conduction requires the evaluation of the PR interval, QRS duration and QT interval.
PR Interval
- The PR interval is measured from the beginning of the P wave to the beginning of the QRS complex.*The PR interval reflects the time the electrical impulse takes to travel from the sinus node through the AV node where it enters the ventricles. The PR interval is therefore a good estimate of AV node function.
- The PR interval is normally between 120 to 200 ms long (3 to 5 small boxes).
- A long PR interval (of over 200 ms) may indicate a first-degree heart block or electrolyte disturbances (for example hypokalemia)
- A variable PR interval may indicate other types of heart block.
- Mobitz 1
- Mobitz 2
- Third degree heart block
- A short PR interval may indicate a pre-excitation syndrome via an accessory pathway that leads to early activation of the ventricles, such as seen in Wolf Parkinson White syndrome
The Duration of QRS
- The QRS duration indicates how fast the ventricles depolarize.
- The normal QRS is normally < 0.10 seconds
- When the QRS duration is longer than 110 miliseconds, a conduction delay is present.
- Possible causes of a QRS duration > 110 miliseconds include:
- Left bundle branch block
- Right bundle branch block
- Electrolyte disorders
- Idioventricular rhythm and paced ryhtm
- Possible causes of a QRS duration > 110 miliseconds include:
- For the diagnosis of LBBB or RBBB QRS duration must be >120 ms.
The QT Interval
- The QT interval indicates how fast the ventricles are repolarized, becoming ready for a new cycle.
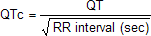
- The QT interval comprises the QRS-complex, the ST-segment, and the T-wave. One difficultly of QT interpretation is that the QT interval gets shorter as the heart rate increases. This problem can be solved by correcting the QT time for heart rate .
- Calculation of QTc using the tangent method:
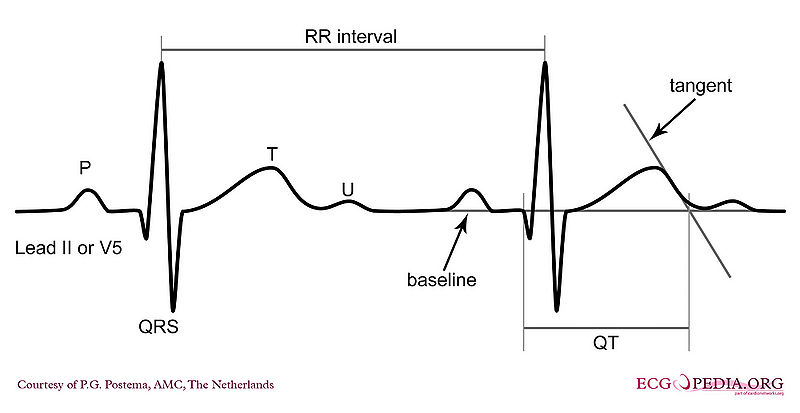
- Use lead II. Use lead V5 alternatively if lead II cannot be read.
- Draw a line through the baseline (preferably the PR segment)
- Draw a tangent against the steepest part of the end of the T wave. If the T wave has two positive deflections, the taller deflection should be chosen. If the T wave is biphasic, the end of the taller deflection should be chosen.
- The QT interval starts at the beginning of the QRS interval and ends where the tangent and baseline cross.
- Calculation of QTc using Bazett’s equation:
- Calculation of QTc using the tangent method:
- The normal value for QTc (corrected QT interval) is: below 450ms for men and below 460ms for women.
- If QTc is < 340ms short QT syndrome can be considered.
- The QT interval is prolonged in congenital long QT syndrome, but QT prolongation can also occur be acquire as a results of:
- Medication (anti-arrhythmics, tricyclic antidepressants, phenothiazedes, …)
- Electrolyte imbalances
- Ischemia

Cardiac Axis
The cardiac axis is an imaginary vector corresponding to the average of the different depolarization vectors in the heart. The depolarization wave begins in the right atrium and spread to the left and right ventricle. Because the left ventricle wall muscle mass is larger than the right wall muscle mass, the arrow representing the direction of the depolarization wave is directed towards the left.
The limb leads look at heart in a vertical plan
- The normal depolarization vector is directed towards leads I, II and III. Hence, the deflections in these leads are positive in such a way that the deflection in lead II is more positive than that in leads I and III.
- The shapes of the QRS complex in leads I, II ad III are used to estimate the cardiac axis.
- Keep in mind that:
- When the depolarization is directed towards the lead, the ECG recording in that lead will show positive deflection.
- When the depolarization is directed away from the lead, the ECG recording in that lead will show negative deflection.
- A positive deflection is defined as the QRS having a larger 'area under the curve' above the baseline than below the baseline
- The normal cardiac axis lies between the angles: -30 and +90 degrees.


- If right axis deviation is present, the axis will be tilted towards the right. Hence, the axis will be going away from lead I and thus R will be smaller than S in lead I and the axis will be going more towards lead III and thus R will be larger than S in lead III.
- If R is equal to S in lead II, then it is expected that the cardiac axis lies at a right angle from lead II. Hence, the cardiac axis would be either at an angle of -30 degrees or +150 degrees. The shape of the QRS complex, whether positively or negatively deflected, helps in determining the direction of the cardiac axis.

The V leads look at the heart in a horizontal plan
- The depolarization first occurs in the septum (from left to right) before spreading to the ventricles.
- The V leads reflect the depolarization of the following areas of the heart:
- V1 and V2: the right ventricle
- V3 and V4: the septum
- V5 and V6: the left ventricle
- The septal depolarization corresponds to an initial positive deflection (R wave) in V1 and V2 and negative deflection (Q wave) in V3 and V4.
- Because the left ventricular mass is larger than that of the right ventricle, the vector corresponding to the ventricular mass depolarization is directed towards the left. Thus, the ventricular depolarization corresponds to a negative deflection (S wave) in V1 and V2 and a positive deflection (R wave) in V3 and V4.
- The progression of V1 to V6 is important to notice: The QRS complex is predominantly deflected downwards in V1 and gradually becomes positively deflected to show a predominantly upwards deflection in V6
The transition of progression corresponds to an R wave equal to the S wave. This is an indication of the position of the interventricular septum.
- For example, if there is right ventricular hypertrophy, the septum will be more deviated towards the left and the transition of progression will become located in V5, V6 or even V7 instead of V3 or V4.