Encephalopathy MRI
|
Encephalopathy |
|
Diagnosis |
|---|
|
Treatment |
|
Encephalopathy MRI On the Web |
|
American Roentgen Ray Society Images of Encephalopathy MRI |
Editor-In-Chief: C. Michael Gibson, M.S., M.D. [1] ; Associate Editor(s)-in-Chief: Aditya Govindavarjhulla, M.B.B.S. [2]
Overview
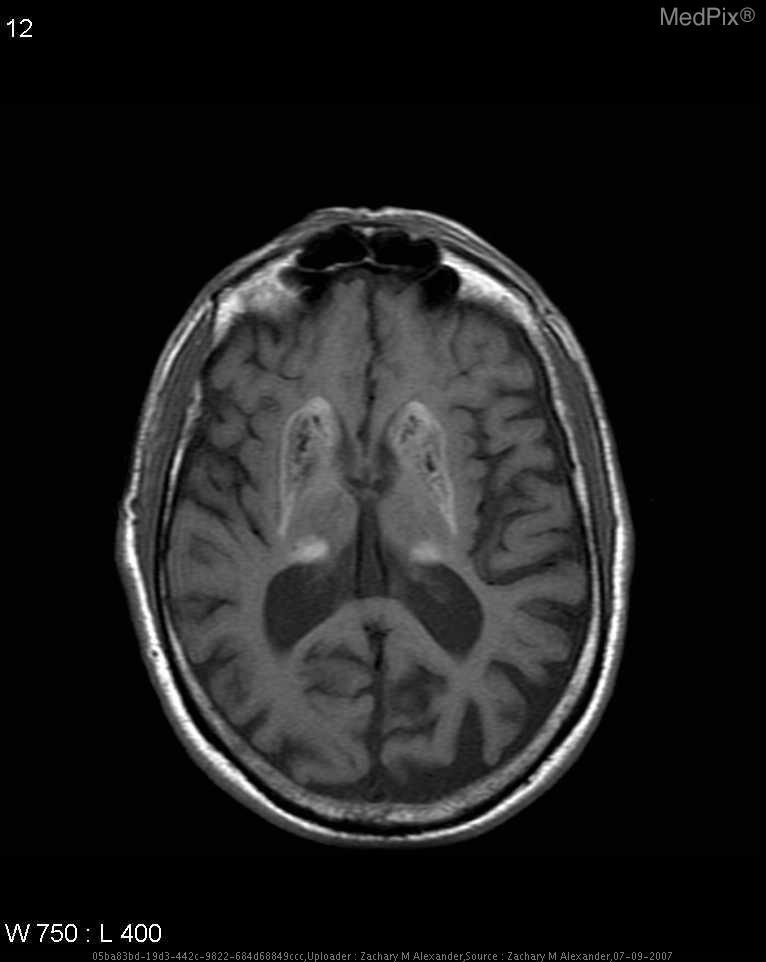
More effective than CT scan in identifying lesions. Useful in differentiating the hepatic encephalopathy from the underlying brain causes. Increased resonance in T1 weighted images in hepatic encephalopathy due to manganese.[1]
MRI Scan
- More effective than CT scan in identifying lesions
- Useful in differentiating the hepatic encephalopathy from the underlying brain causes.
- Increased signal sensitivity in globus pallidus on T1 weighted images.[2]
- This intensity may be due to accumulation of manganese[1]
- Basal Ganglia changes are evident on MRI due to high metabolic activity in majority causes of metabolic encephalopathy.[3]

Magnetic Resonance Spectroscopy (MRS)
- Non invasive method which allows serial measurement of various neuro metabolites in brain.[5]
- Patients of hepatic encephalopathy show increase in glutamate.
- MRI and MRS are correlated with other brain lesions like parkinson's disease. It helps in differentiating from encephalopathy.[6]
References
- ↑ 1.0 1.1 Krieger D, Krieger S, Jansen O, Gass P, Theilmann L, Lichtnecker H (1995). "Manganese and chronic hepatic encephalopathy". Lancet. 346 (8970): 270–4. PMID 7630246. Unknown parameter
|month=ignored (help) - ↑ Kulisevsky J, Pujol J, Balanzó J; et al. (1992). "Pallidal hyperintensity on magnetic resonance imaging in cirrhotic patients: clinical correlations". Hepatology. 16 (6): 1382–8. PMID 1446893. Unknown parameter
|month=ignored (help) - ↑ Bathla G, Hegde AN (2013). "MRI and CT appearances in metabolic encephalopathies due to systemic diseases in adults". Clin Radiol. 68 (6): 545–54. doi:10.1016/j.crad.2012.05.021. PMID 23142023.
- ↑ "MedPix Topic - Fahr Disease, Fahr Syndrome".
- ↑ Taylor-Robinson SD, Sargentoni J, Marcus CD, Morgan MY, Bryant DJ (1994). "Regional variations in cerebral proton spectroscopy in patients with chronic hepatic encephalopathy". Metab Brain Dis. 9 (4): 347–59. PMID 7898401. Unknown parameter
|month=ignored (help) - ↑ Laubenberger J, Häussinger D, Bayer S, Gufler H, Hennig J, Langer M (1997). "Proton magnetic resonance spectroscopy of the brain in symptomatic and asymptomatic patients with liver cirrhosis". Gastroenterology. 112 (5): 1610–6. PMID 9136840. Unknown parameter
|month=ignored (help)