Short bowel syndrome electrocardiogram
|
Short bowel syndrome Microchapters |
|
Diagnosis |
|---|
|
Treatment |
|
Case Studies |
|
Short bowel syndrome electrocardiogram On the Web |
|
American Roentgen Ray Society Images of Short bowel syndrome electrocardiogram |
|
Risk calculators and risk factors for Short bowel syndrome electrocardiogram |
Editor-In-Chief: C. Michael Gibson, M.S., M.D. [1]; Associate Editor(s)-in-Chief: Sadaf Sharfaei M.D.[2]
Overview
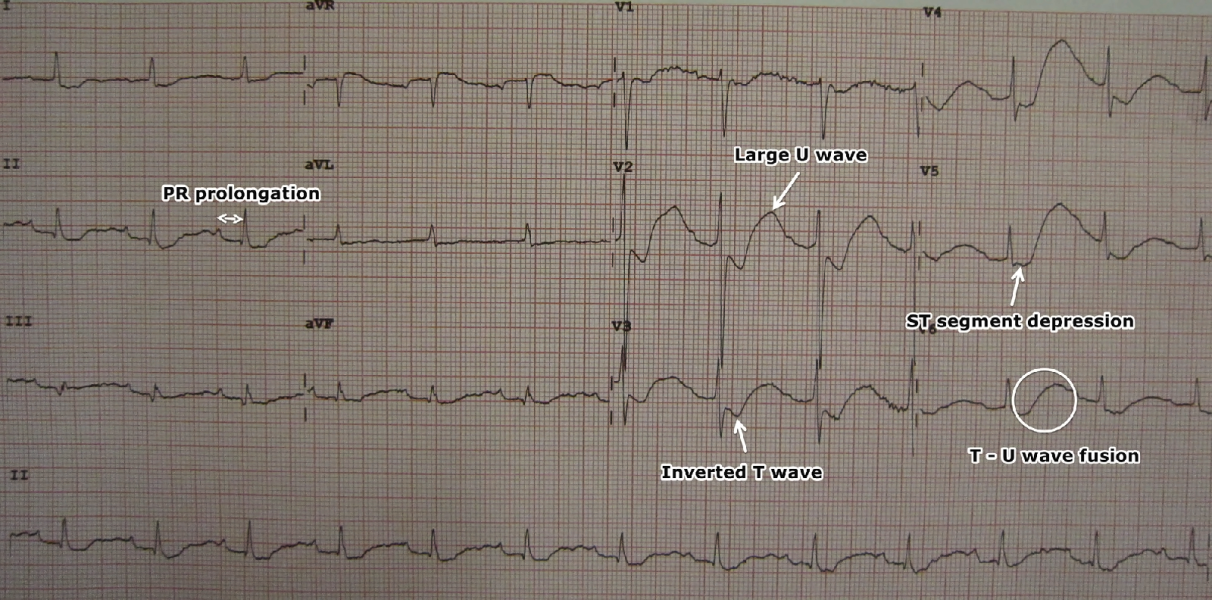
There are no ECG findings associated with short bowel syndrome. In case of malnutrition and electrolyte imbalance, an ECG may be helpful. Hypokalemia might present with arrhythmia, ST segment depression, low T wave, prominent U waves and QRS prolongation. Hypocalcemia might present with QT interval prolongation. Hypomagnesemia might present with QT interval prolongation and ventricular and supraventricular arrhythmia.
Electrocardiogram
- There are no ECG findings associated with short bowel syndrome.
- In case of malnutrition and electrolyte imbalance, an ECG may be helpful.[1]
- Findings on an ECG suggestive of hypokalemia in a patient with short bowel syndrome include:[2][3][4]
- ST segment depression
- Low T wave
- Prominent U waves
- Prolongation of the QRS duration
- Increase in the amplitude and duration of the P-wave
- Cardiac arrhythmias and AV block
- Ventricular ectopy

- Findings on an ECG suggestive of hypocalcemia in a patient with short bowel syndrome include:[6]
- Findings on an ECG suggestive of hypomagnesemia in a patient with short bowel syndrome include:[7]

References
- ↑ Diercks DB, Shumaik GM, Harrigan RA, Brady WJ, Chan TC (2004). "Electrocardiographic manifestations: electrolyte abnormalities". J Emerg Med. 27 (2): 153–60. doi:10.1016/j.jemermed.2004.04.006. PMID 15261358.
- ↑ Levis JT (2012). "ECG diagnosis: hypokalemia". Perm J. 16 (2): 57. PMC 3383164. PMID 22745618.
- ↑ Pepin J, Shields C (2012). "Advances in diagnosis and management of hypokalemic and hyperkalemic emergencies". Emerg Med Pract. 14 (2): 1–17, quiz 17–8. PMID 22413702.
- ↑ El-Sherif N, Turitto G (2011). "Electrolyte disorders and arrhythmogenesis". Cardiol J. 18 (3): 233–45. PMID 21660912.
- ↑ "File:LowKECG.JPG - Wikimedia Commons". External link in
|title=(help) - ↑ Fong J, Khan A (2012). "Hypocalcemia: updates in diagnosis and management for primary care". Can Fam Physician. 58 (2): 158–62. PMC 3279267. PMID 22439169.
- ↑ Iannello S, Prestipino M, Cavalleri A, Spina S, Belfiore F (1997). "[Precordial discomfort and ECG changes of repolarization associated with hypomagnesemia in a young women following colectomy for diffuse colonic lipomatosis]". Minerva Cardioangiol (in Italian). 45 (11): 581–6. PMID 9549292.